This course is about statistical modelling which falls under the analyzing data objective.
- So what is a statistical model?
- A statistical model will be a mathematical structure used to imitate, And approximate, the data generating process. It typically describes relationships among variables while accounting for uncertainty and variability in the data.
For what kinds of problems might we use a statistical model?
- Quantifying uncertainty:
- are relationships between variables we cannot measure?
- how many people were polled?
- how were they chosen?
- how would the data change if we repeated the poll.
- Inference
Extend the result and infer what percentage of the total population supports the candidate?
We may also have other demographic information about each person in the poll.
A statistical model might allow us to see how these other variables relate to a person’s likelihood of supporting the candidate.
- Measure support for hypothesis
- Does the evidence support a hypothesis that the candidate is more popular with men than women?
- Prediction
- Given demographic information on a voter we could use the model to predict her vote.
- Also important for machine learning.
30.1 A Poll for a political candidate
- 57% for a candidate
- the 99% CI (51,63)
- demographics:
- 55% women
- 63% men
Which objective does statistical modeling most share with machine learning?
Solution. Prediction - This objective is vital to both statistics and machine learning, and is paramount in machine learning.
30.2 Modeling Process 🎥
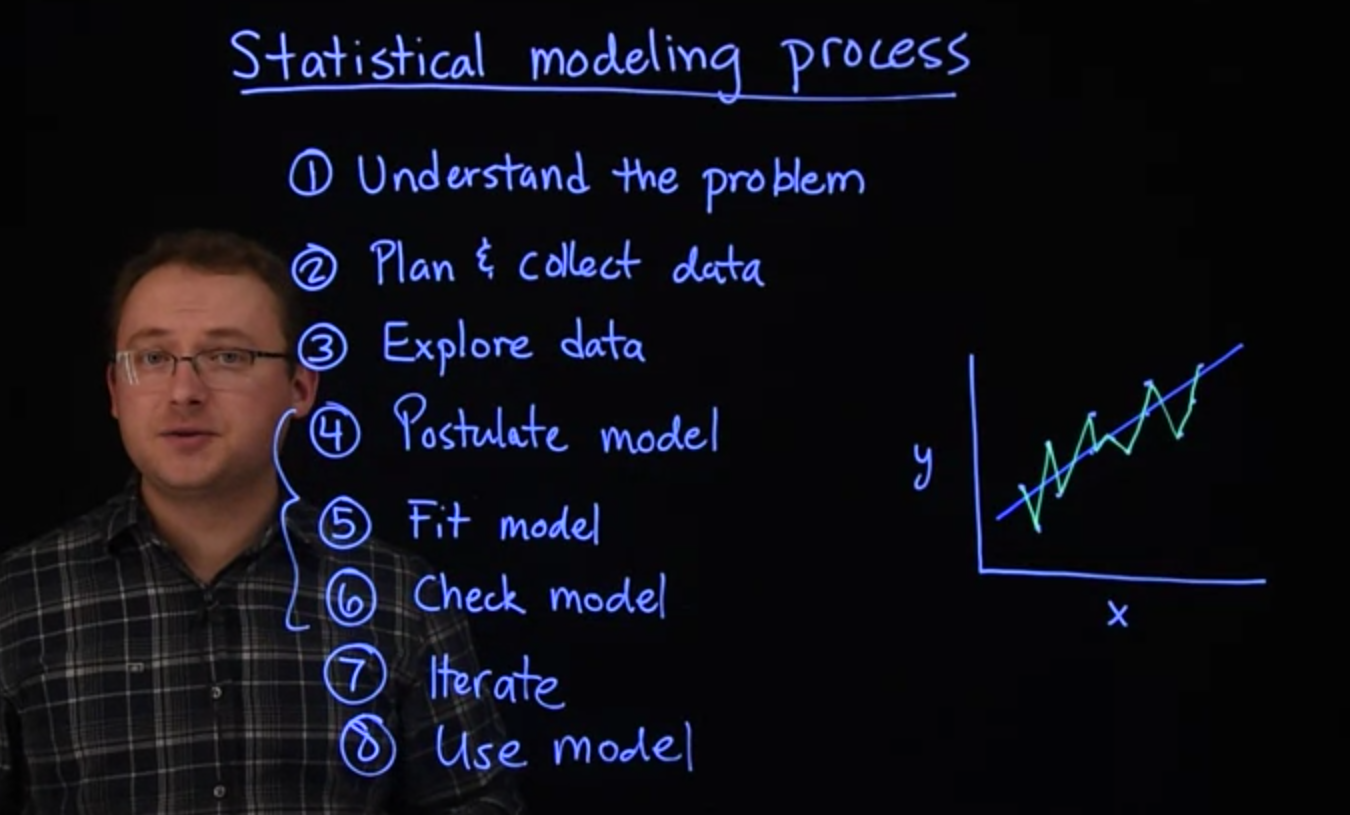
Building statistical models is a process, and each step should be taken carefully. Here we outline the general process and offer some practical advice. We’ll call this the statistical modeling process.
The first step in this process is to understand the problem. This may seem obvious, but understanding the problem and context is critical to success. A sophisticated model might be useless if it is applied inappropriately.
Example 30.1 (international stores) For example, suppose you have revenue data from several different locations of a store chain at unknown locations.
- It seems reasonable to average these revenue numbers as a summary of how the store is doing.
- Suppose you discover that the stores are located in different countries and reported revenues in different currencies.
- Now that average doesn’t seem to have much meaning unless, of course, we get the revenue numbers converted to the same scale.
The second step is to plan and properly collect relevant data. There may be multiple quantities that you could potentially measure to help answer your question. In this step, you decide what information will be most useful to solving your problem. How to collect the data and how many data points to collect. The quality of your data collection plan determines the value of your data.
30.3 peer review survey
For example, if you conduct a survey of peers in your workplace. Your results would likely not generalize to all workers in the company, especially if there are multiple work sites. If you want generalizable results, a better plan would be to select a random sample among all employees to participate in your survey.
The step is addressed in detail in most introductory statistics courses.
The third step in this process is to explore your data. In this step, you should ensure that the data collection plan was followed. And that the data were recorded accurately. If there are major surprises in that data, verified that they are not errors. In this step, you’ll often want to visualize the data to gain a basic understanding of the relationships among your variables. This can help you decide what kinds of models might be appropriate. Finally, the practice of snooping around or mining your data, looking for interesting hypothesis to test can potentially invalidate your statistical modeling results. If you want to mine your data, and test your findings, it is usually best to randomly split your data into two parts. With one part, you can look for interesting things to test and fit different potential models. With the other, you can fit the model you chose using the first part to validate or see if the results can be replicated on other data.
The fourth step in this process is to postulate a model. After gaining an understanding of how your data are structured, choose a model that can appropriately approximate or summarize the interesting content of the data. This might be an off the shelf statistical model like a regression or it could be based on a scientific theory such as a growth model. It could also be multiple models.
Generally, it is desirable to find a model where the parameters we estimate can be interpreted in the context of the original problem. You might also have to strike a balance between model complexity, and model generalizability. This is often referred to as the bias variance trade-off. Large complex models, might be able to fit your particular dataset very well. But may fail to generalize to future data.
Example 30.2 (overfitting) Let’s look at an example of this. Let’s suppose your data looked like where x is your explanatory variable, y is your response variable. And you have points like these. One possible model you could fit would be just a linear regression going through the points.

Another possibility for model you could fit here would be essentially an interpolator that makes sure it goes through every single point. Now, consider a future scenario where you’ve got another dataset just like this one with a new cloud of points. You can imagine that perhaps this interpolated model, which fit the original dataset perfectly, might struggle on a future dataset.
The fifth step in our statistical modeling process is to fit the model. In this step we need to estimate the parameters of the model using the data. In this particular class, we’re going to take a Bayesian approach to this step.
The sixth step in our statistical modeling process is to check the model. Here we want to check to see if the model adequately imitates the data generating process. Are predictions from the model realistic? Does it fit well to your data? Or does it completely miss some of the features? We’ll look into some the techniques for doing this, including residual analysis and predictive checks later in the course. In this step, we may also compare a competing models according to some criteria.
The seventh step in our statistical modeling process is to iterate. That is, return, possibly, to steps 4 through 6. If the model you have already fit is, for some reason, inadequate, we should return to step 4 and proceed through step 6 again with a new, and hopefully better, model that would address or correct the deficiencies from your previous model.
The eighth and final step in our statistical modeling process is to use the model. If we’ve iterated through these enough times and decided that the model is good, or that we have selected an appropriate model, we can use the results to answer your original research questions and arrive at conclusions. In this course, we are going to focus on steps 4 through 8. But this does not mean steps 1 through 3 should be ignored in any analysis. In fact, the importance of steps 1 through 3 cannot be overstated. The validity of you final results depends on them. That is why most introductory statistics courses will emphasize these steps. If you’ll not explore this issues in an introductory statistics course, we highly recommend you do so. We hope you’ll refer to this outline, the statistical modeling process often as you begin modeling data.
30.3.1 Process outline:
- understand the problem.
- plan and collect data.
- explore the data.
- postulate the model.
- fit the model.
- check the model.
- iterate be going beck to step 4.
- use the model.