![]()
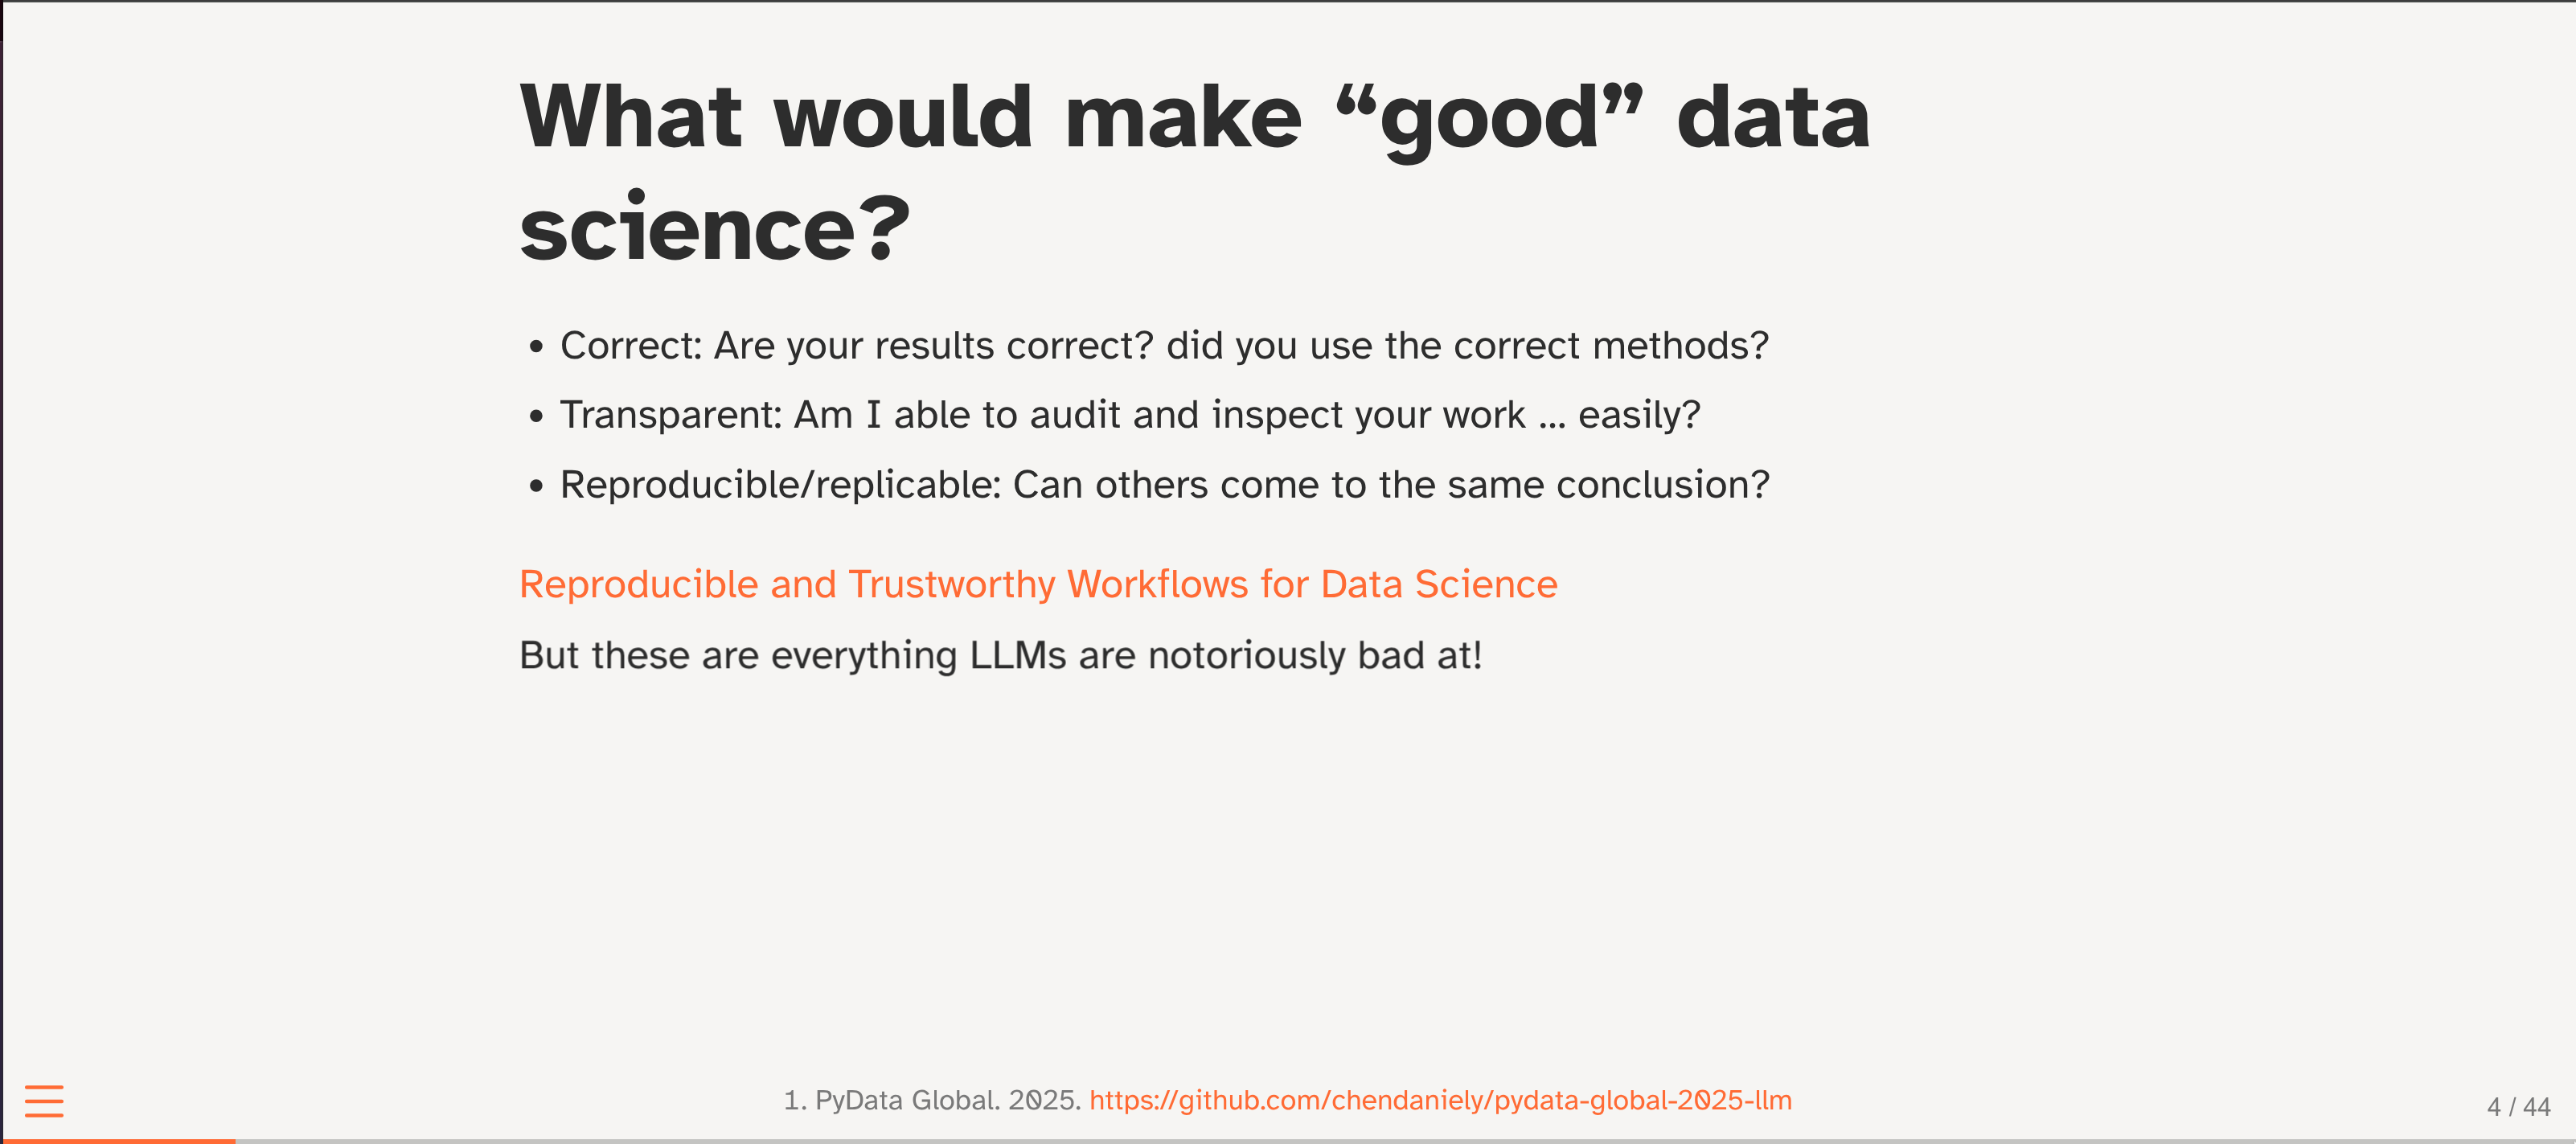
LLMs have a lot of hype around them these days. Let’s demystify how they work and see how we can put them in context for data science use. As data scientists, we want to make sure our results are inspectable, reliable, reproducible, and replicable. We already have many tools to help us in this front. However, LLMs provide a new challenge; we may not always be given the same results back from a query. This means trying to work out areas where LLMs excel in, and use those behaviors in our data science artifacts. This talk will introduce you to LLms, the Chatlas package, and how they can be integrated into a Shiny to create an AI-powered dashboard. We’ll see how we can leverage the tasks LLMs are good at to better our data science products.
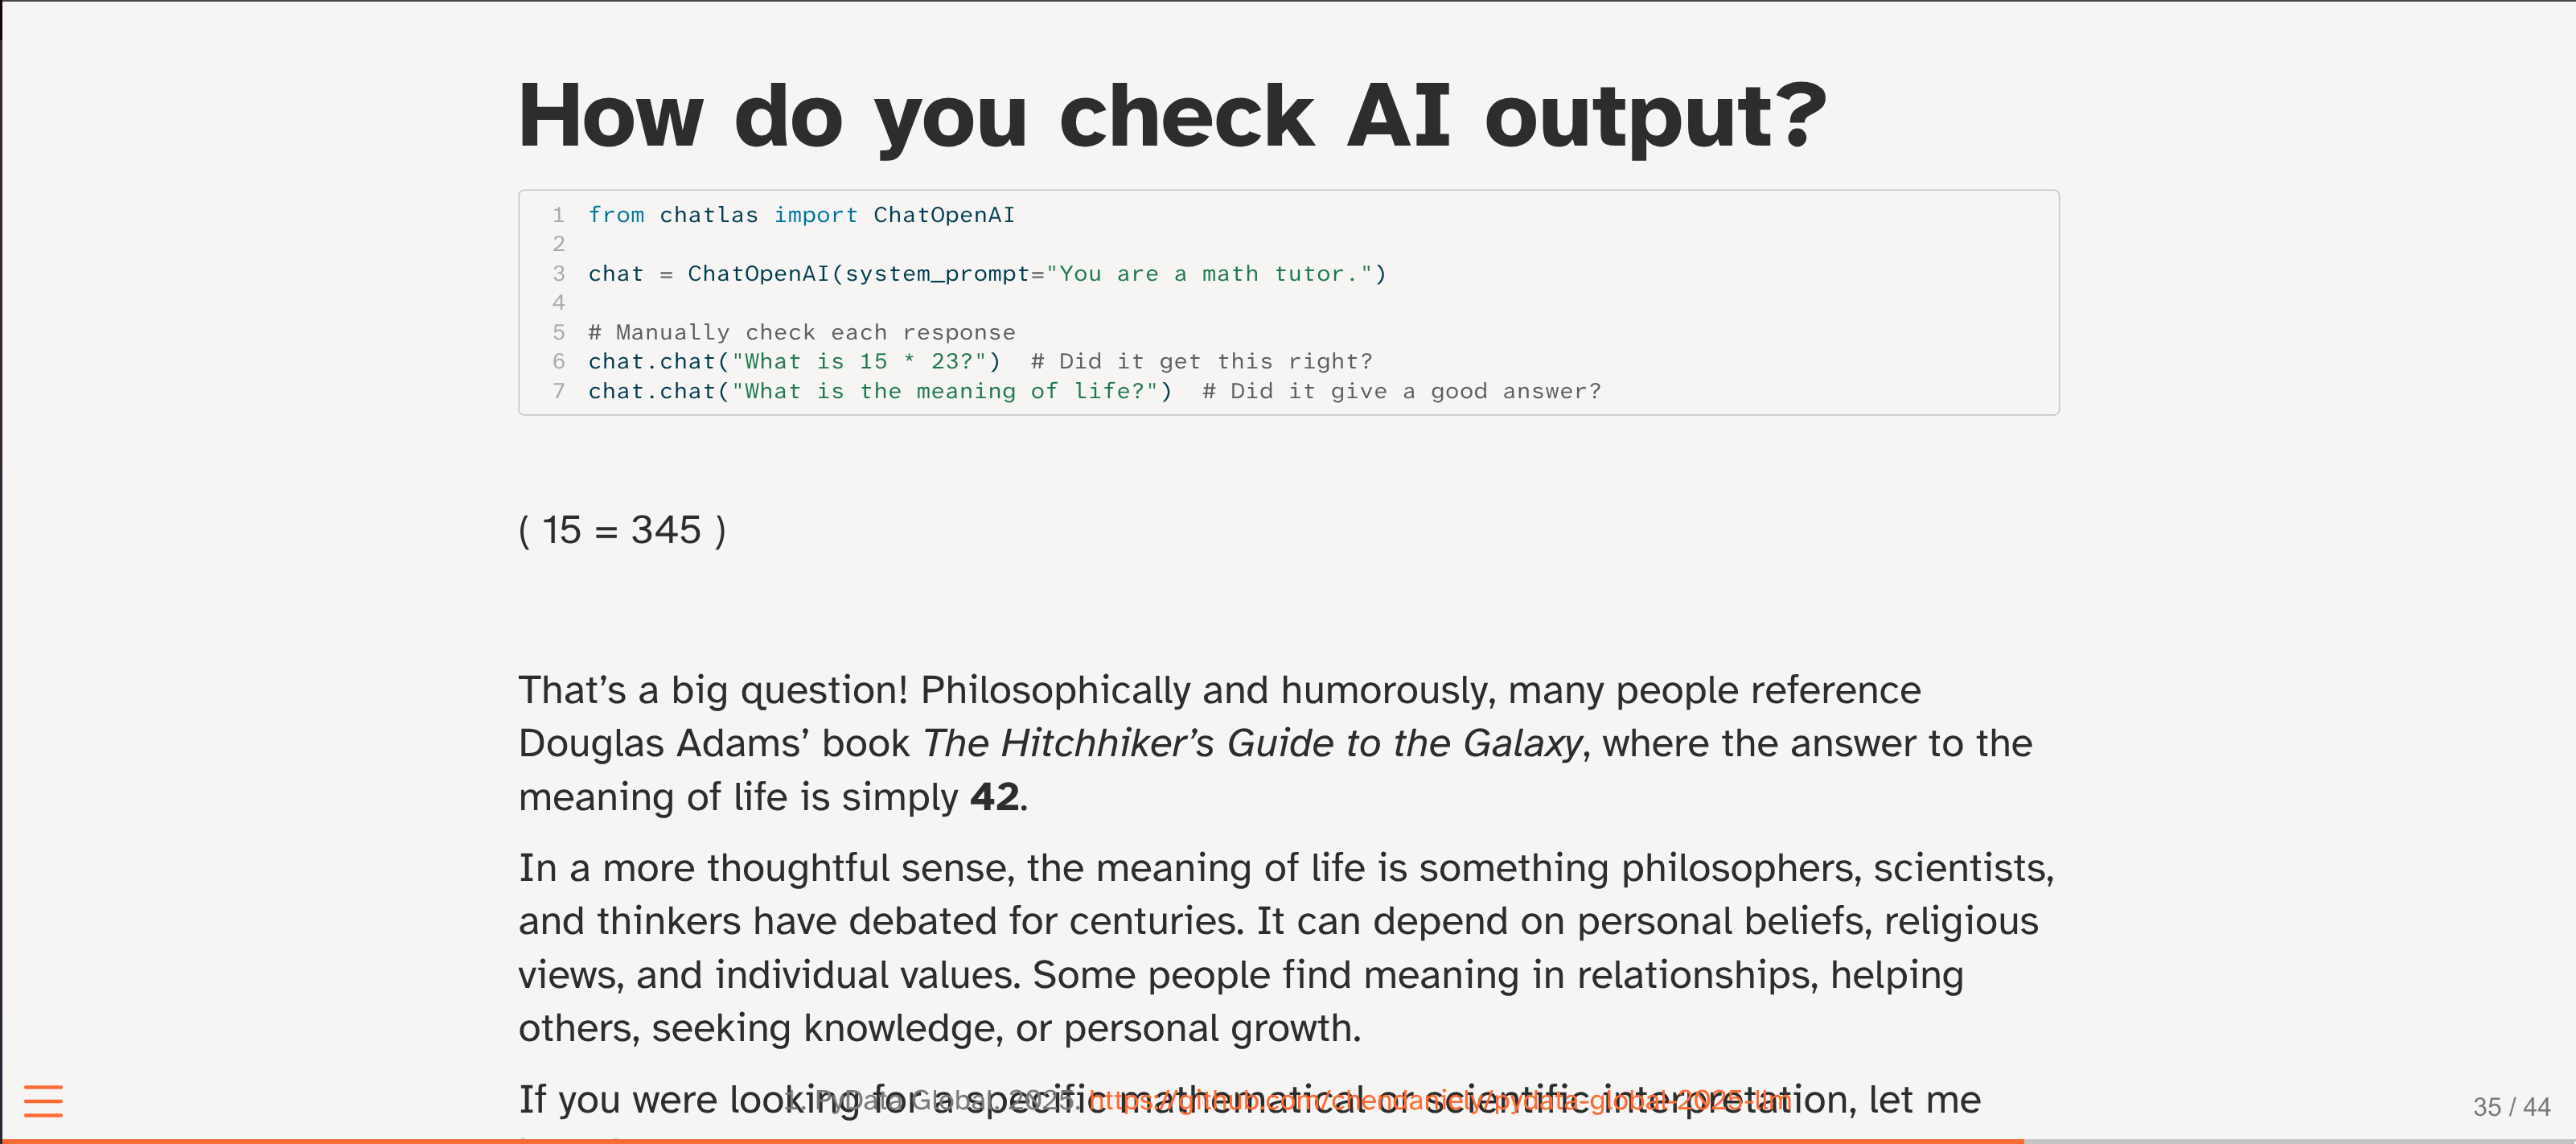
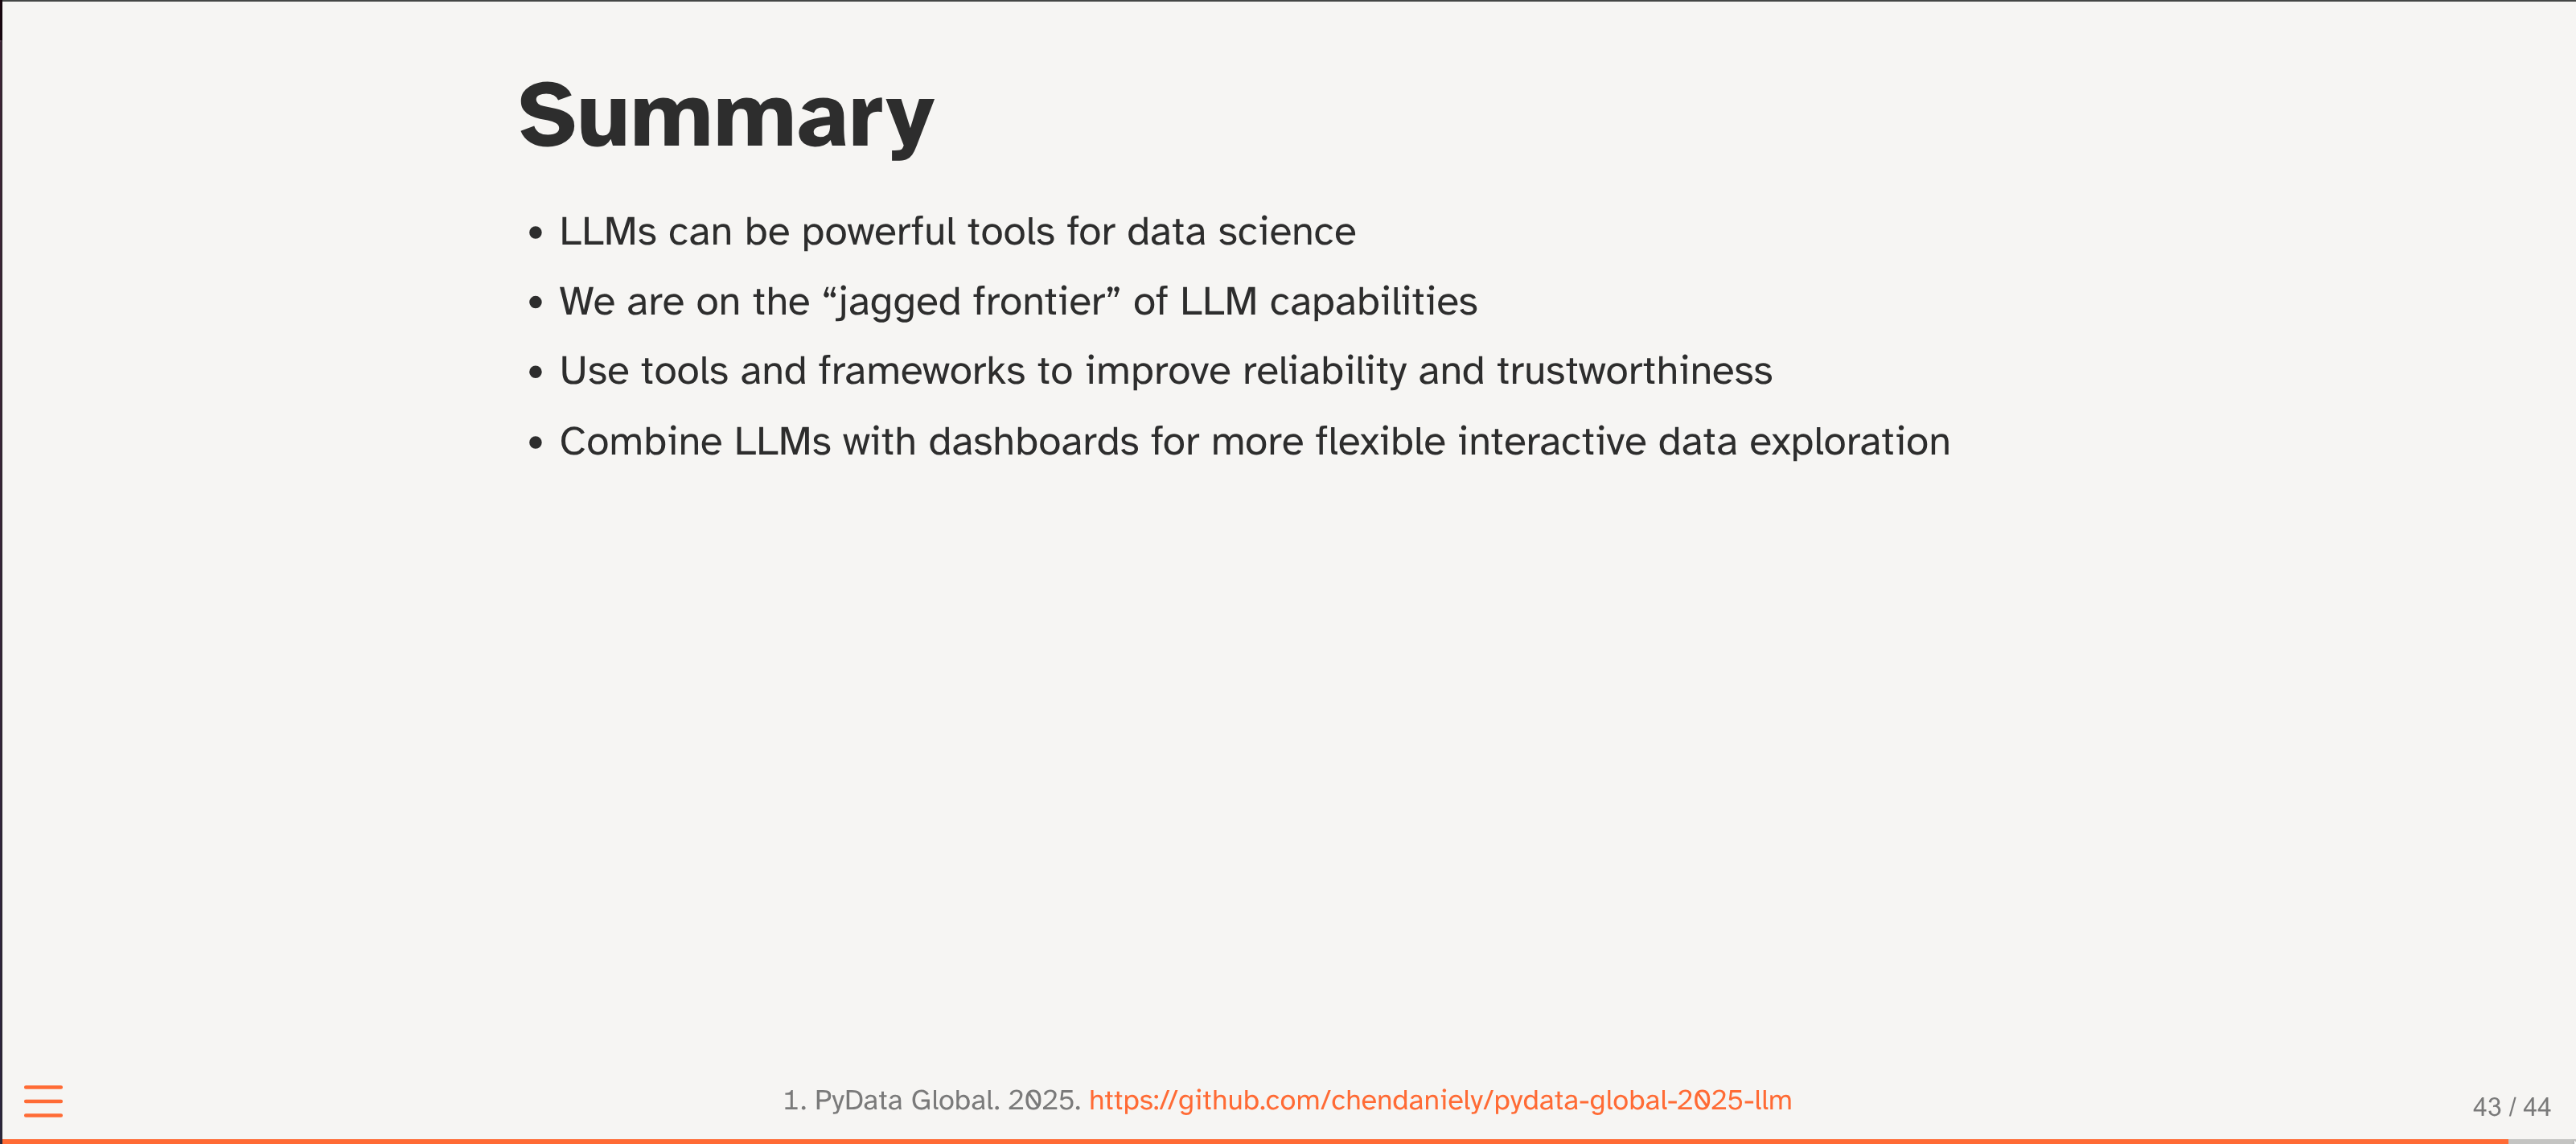
This talk plans to provide data scientists the tools and techniques needed to integrate AI into their data products. Specifically around how to use APIs to work with chat providers and show where and how we can leverage tasks LLMs are good at to make sure we are confident with their output.
- Shiny - Data dashboards in R
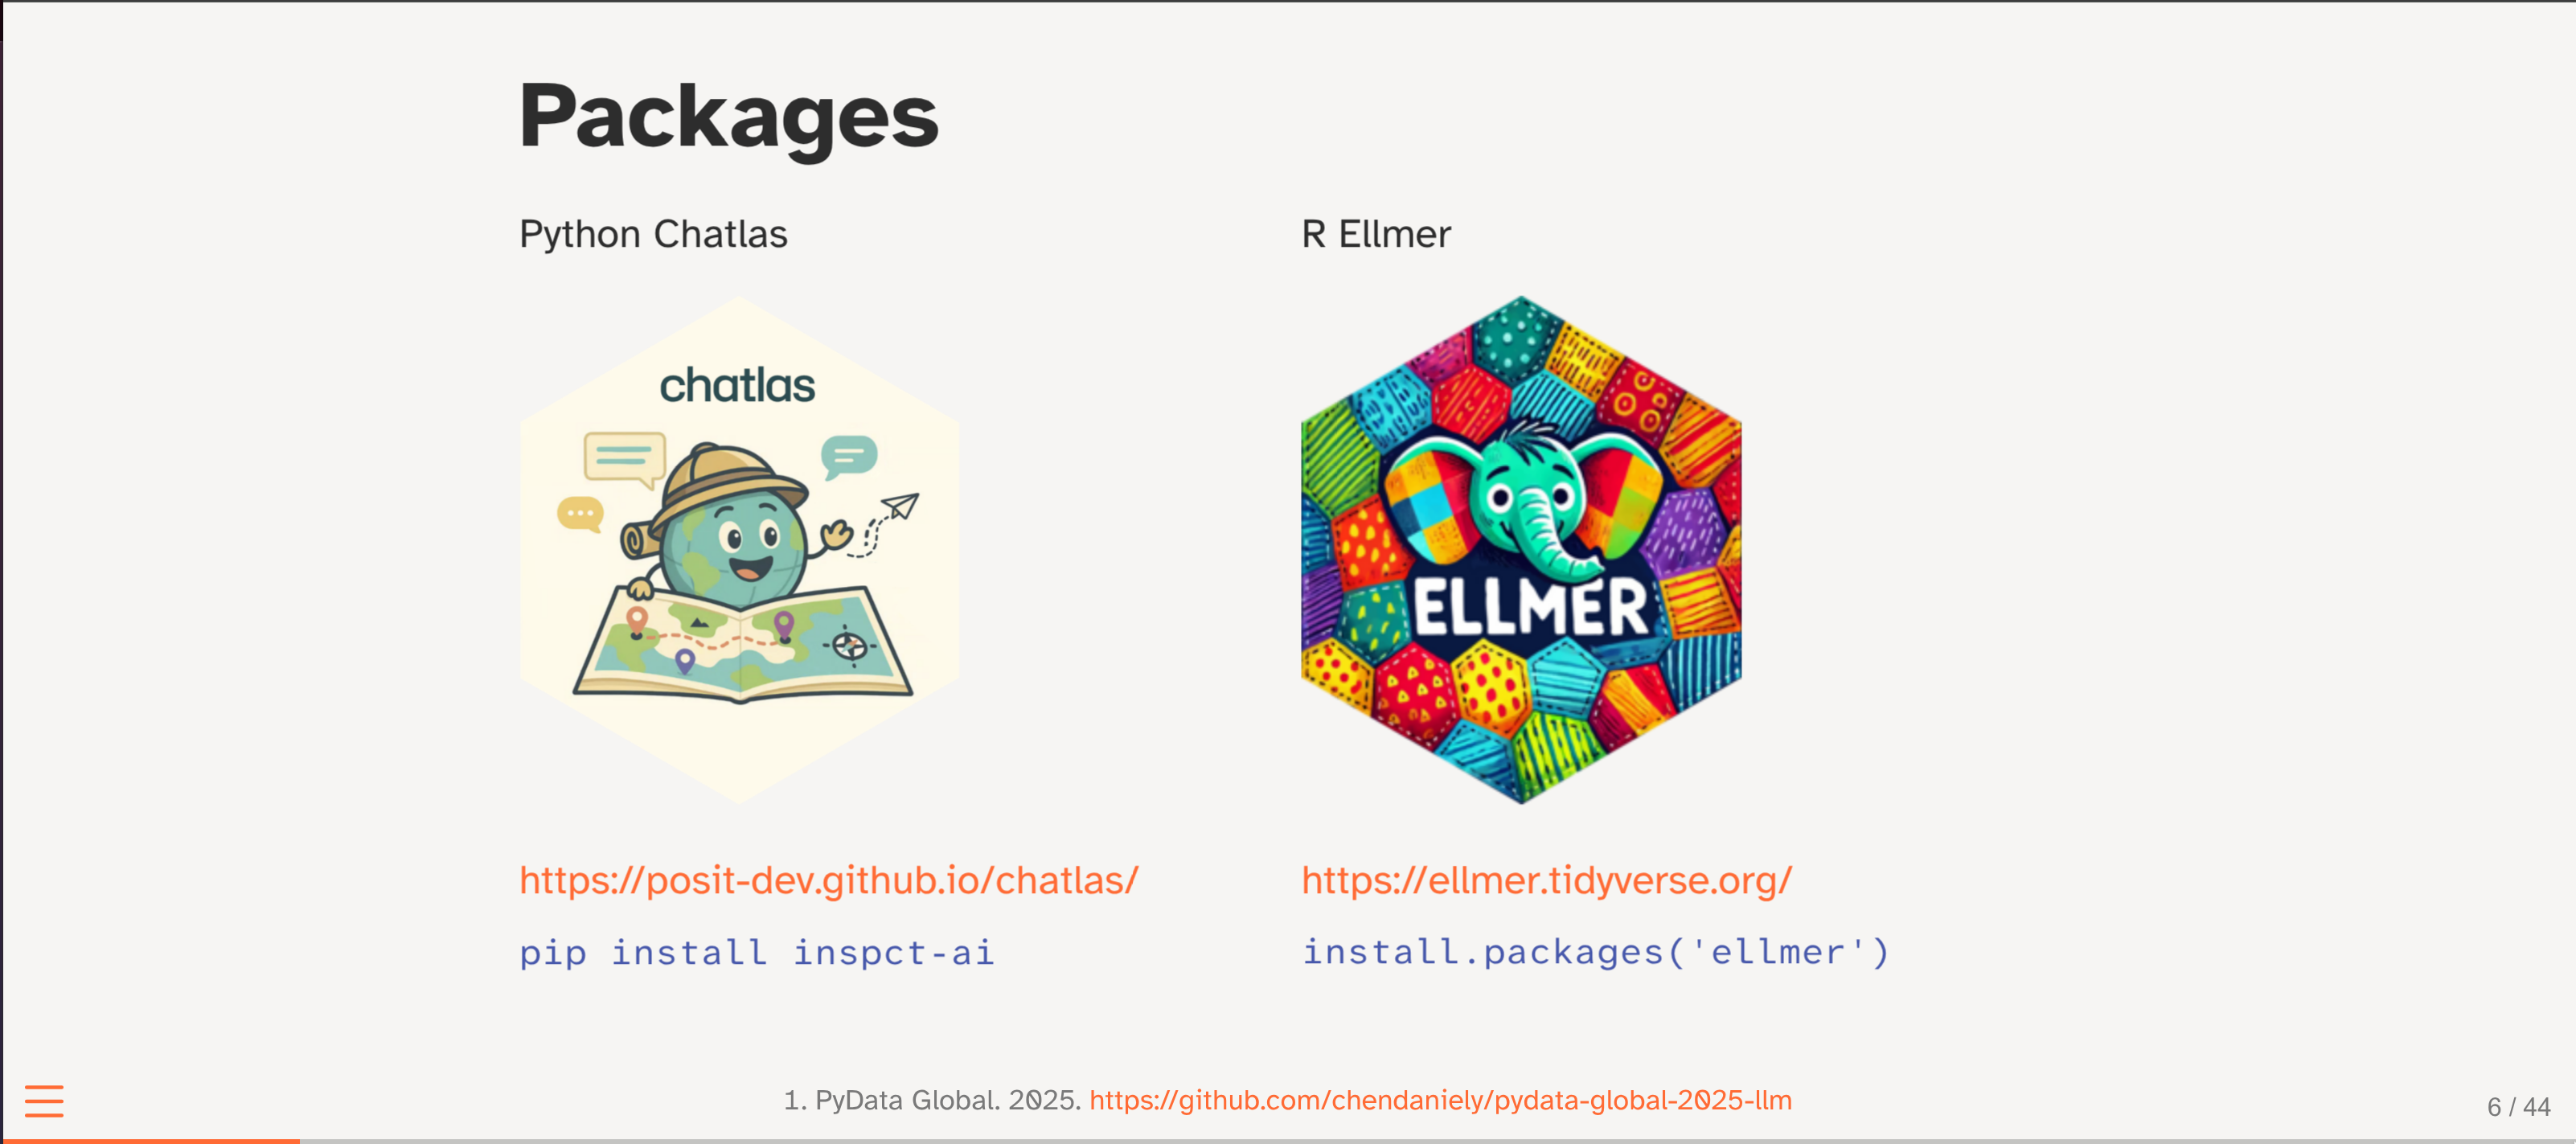
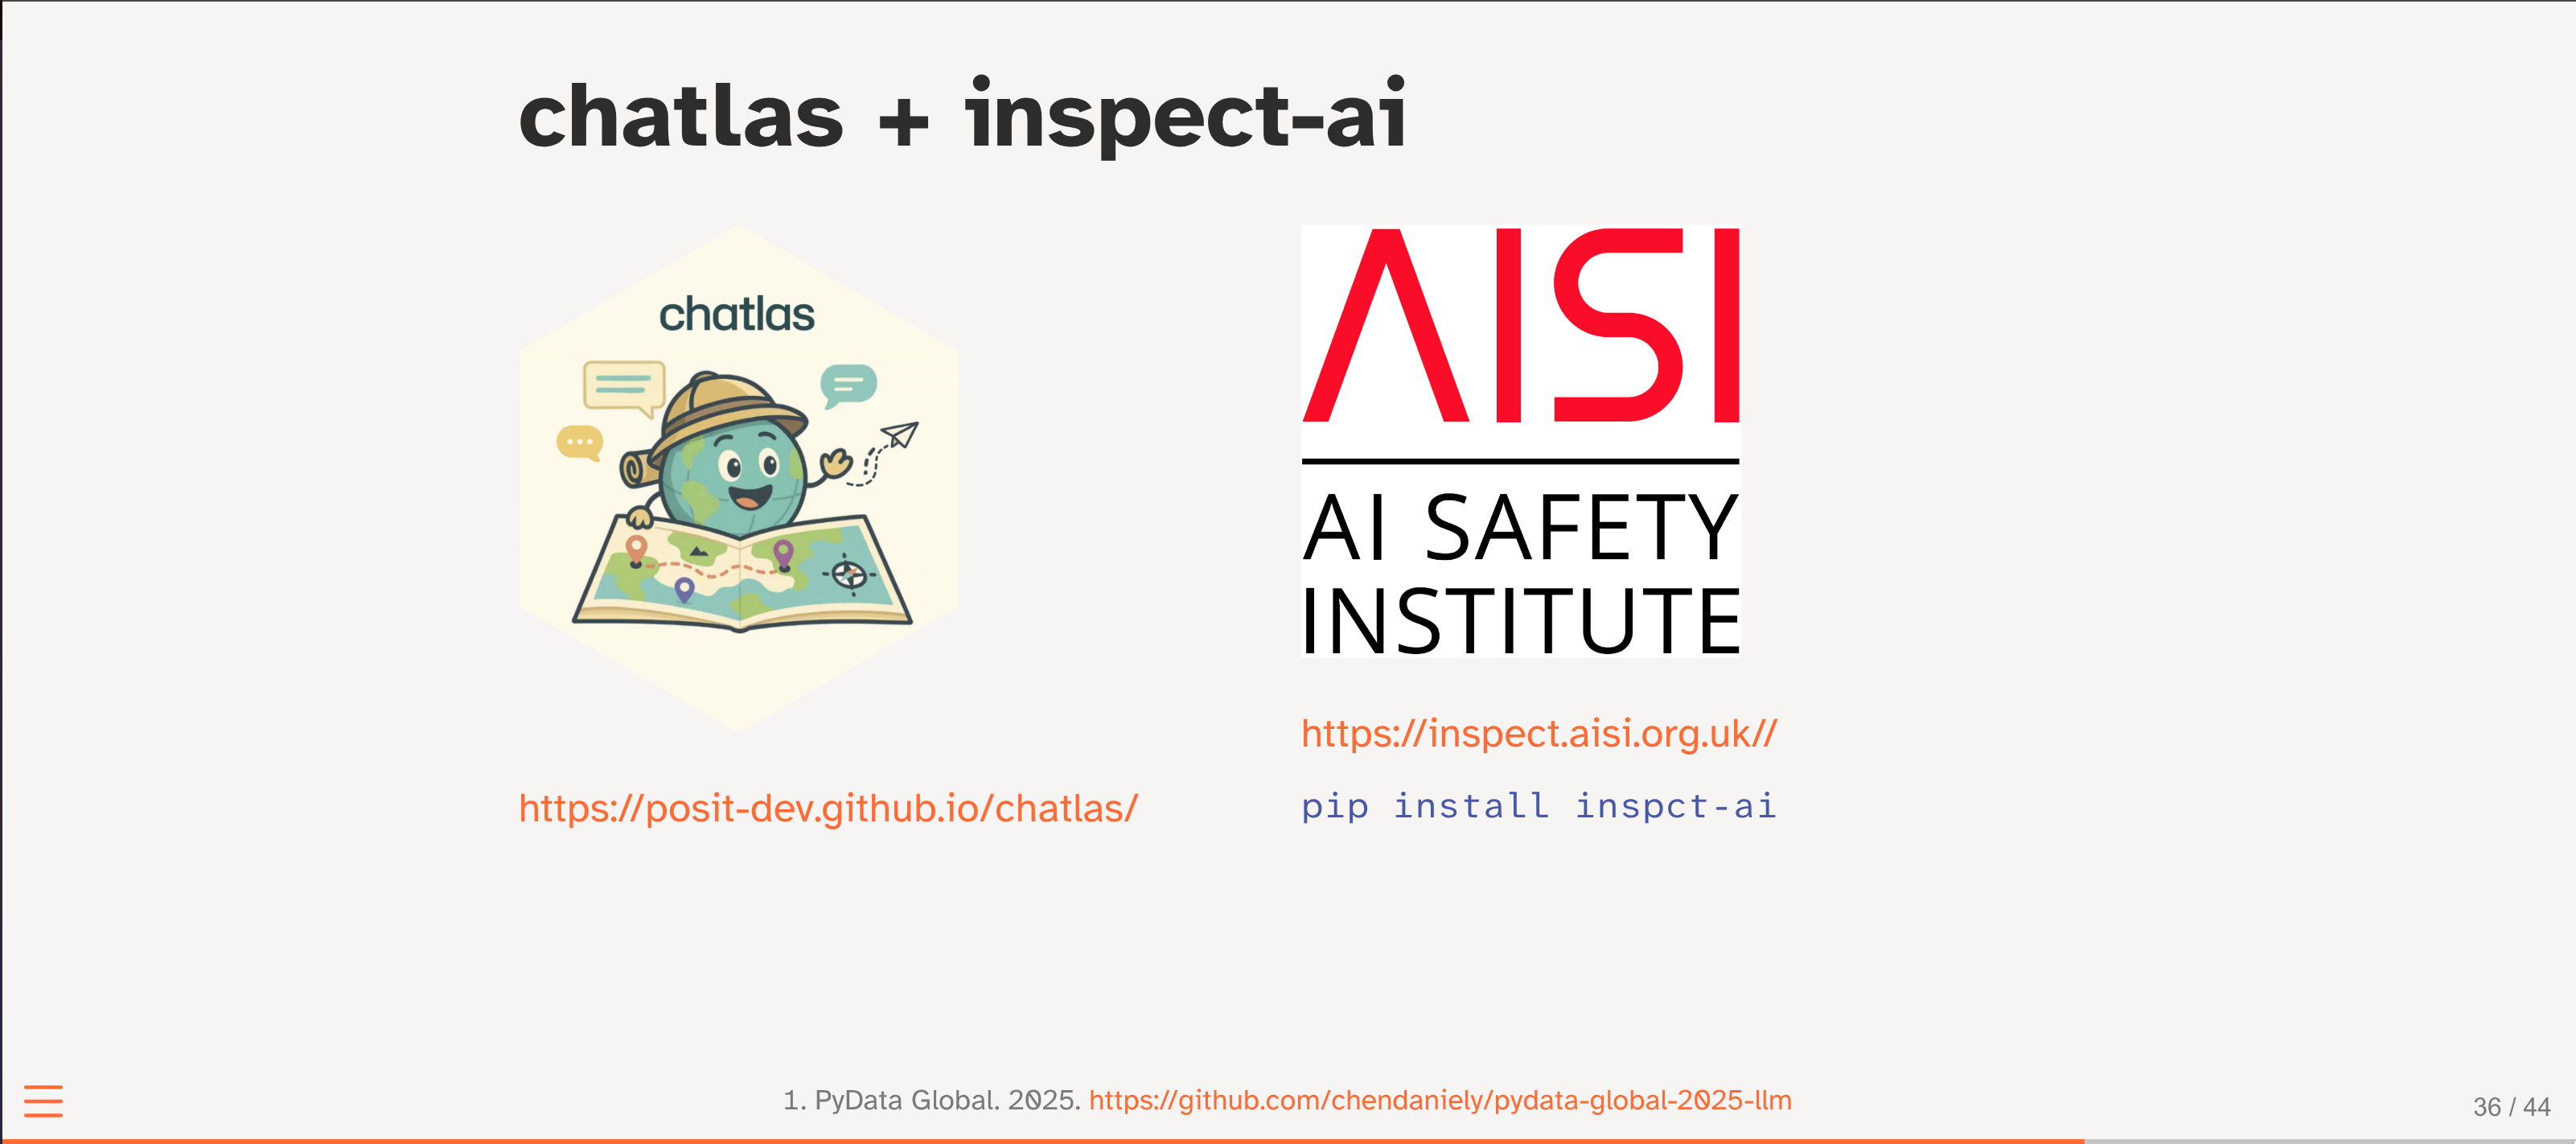
- Chatlas - R package to work with LLMs in data science contexts
- elmer - R package to Call LLM APIs from R
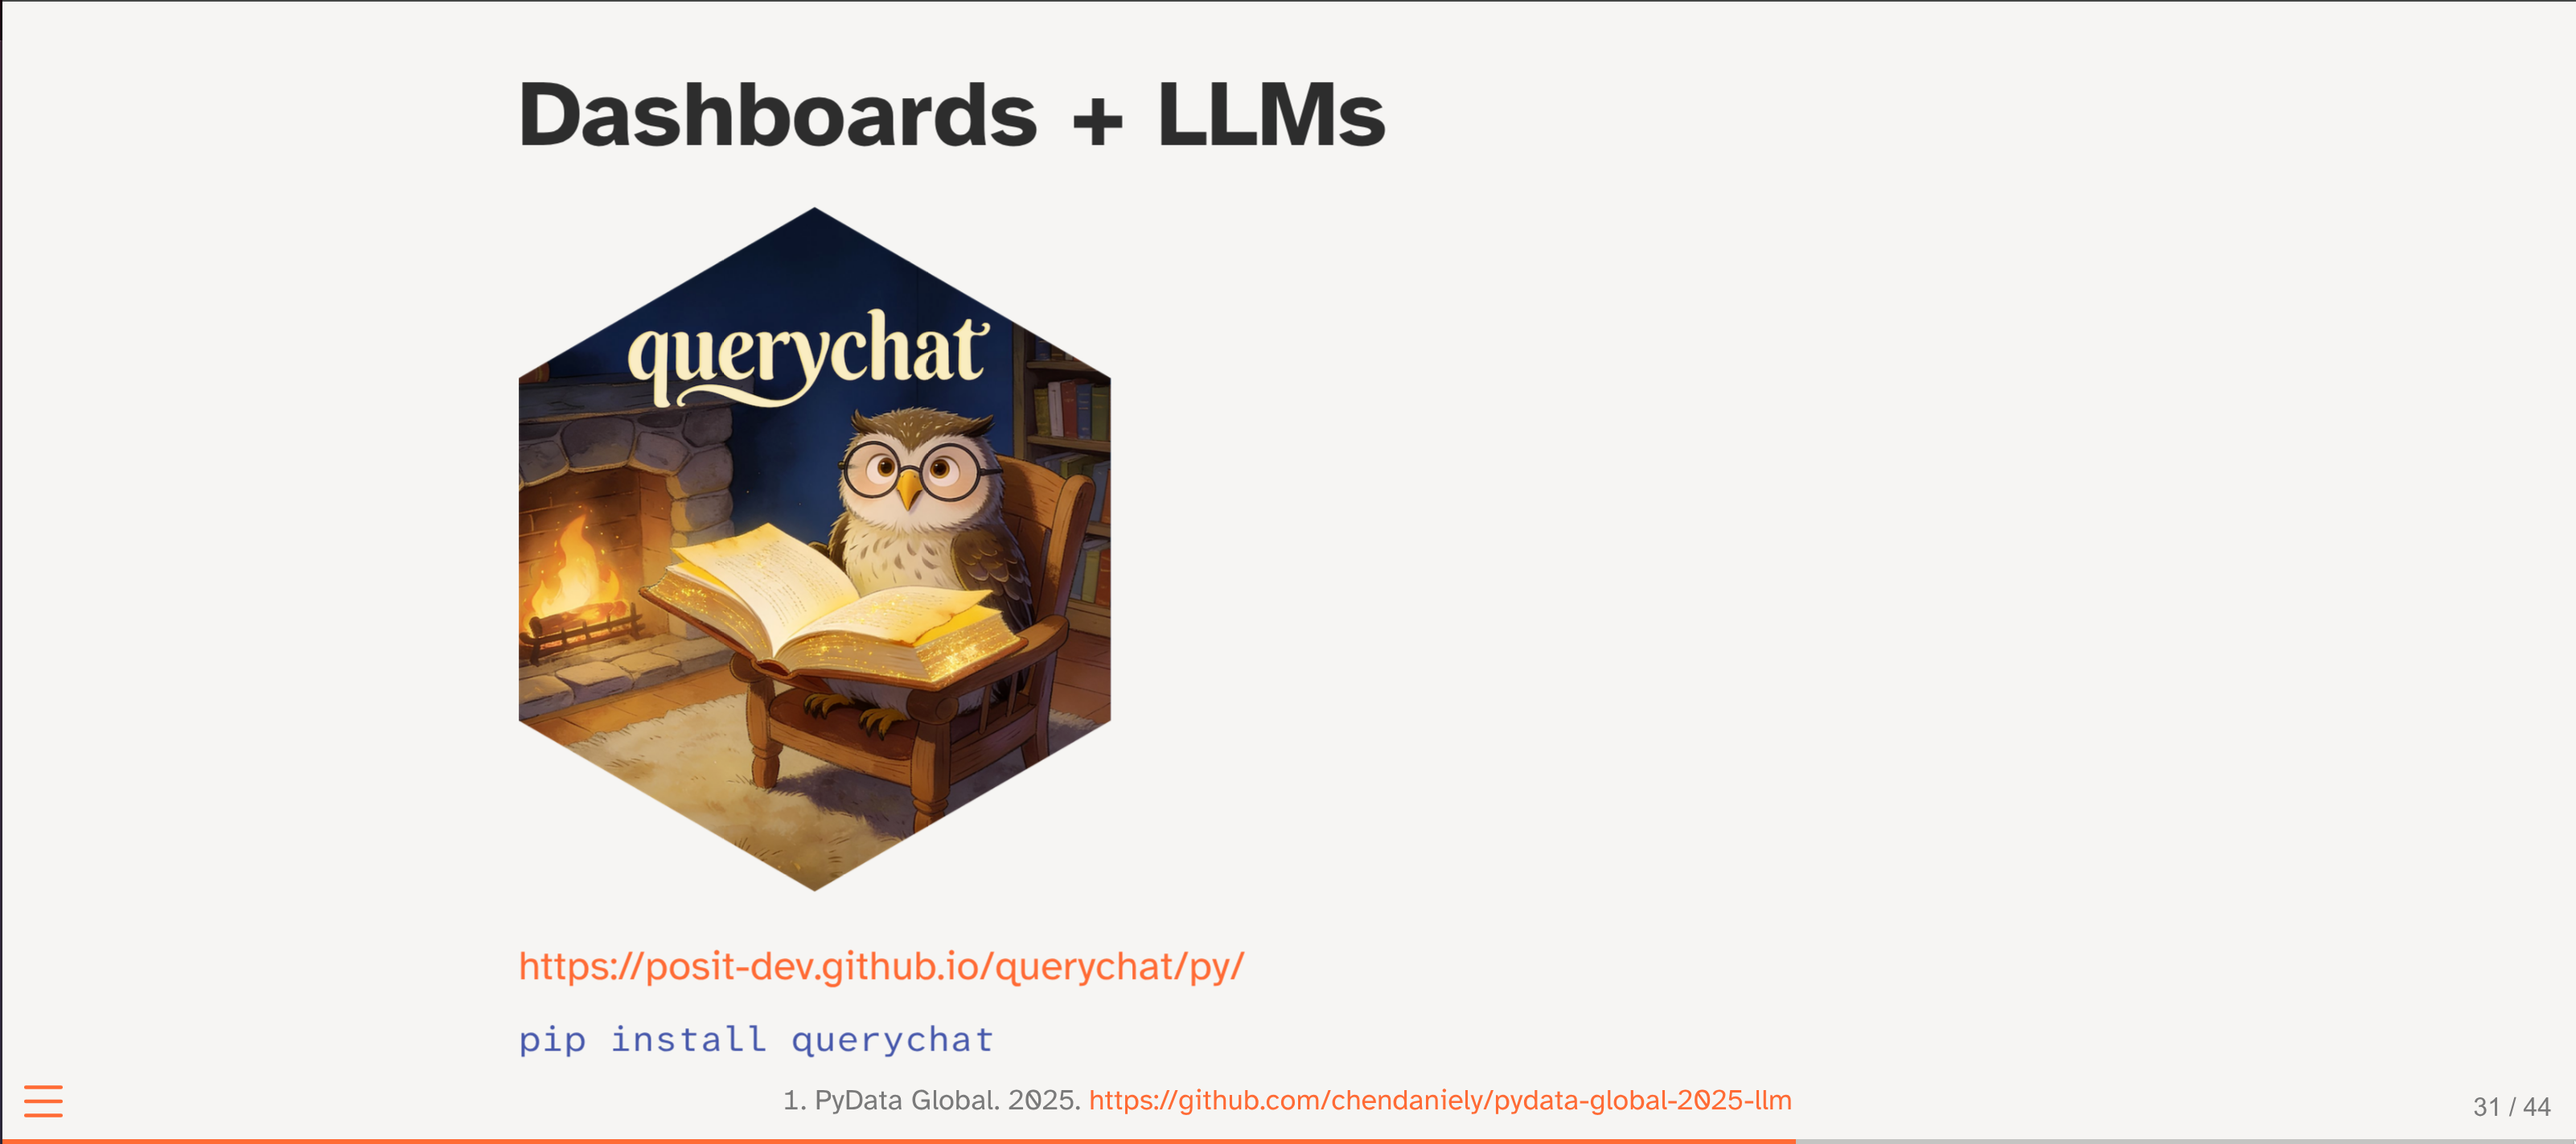
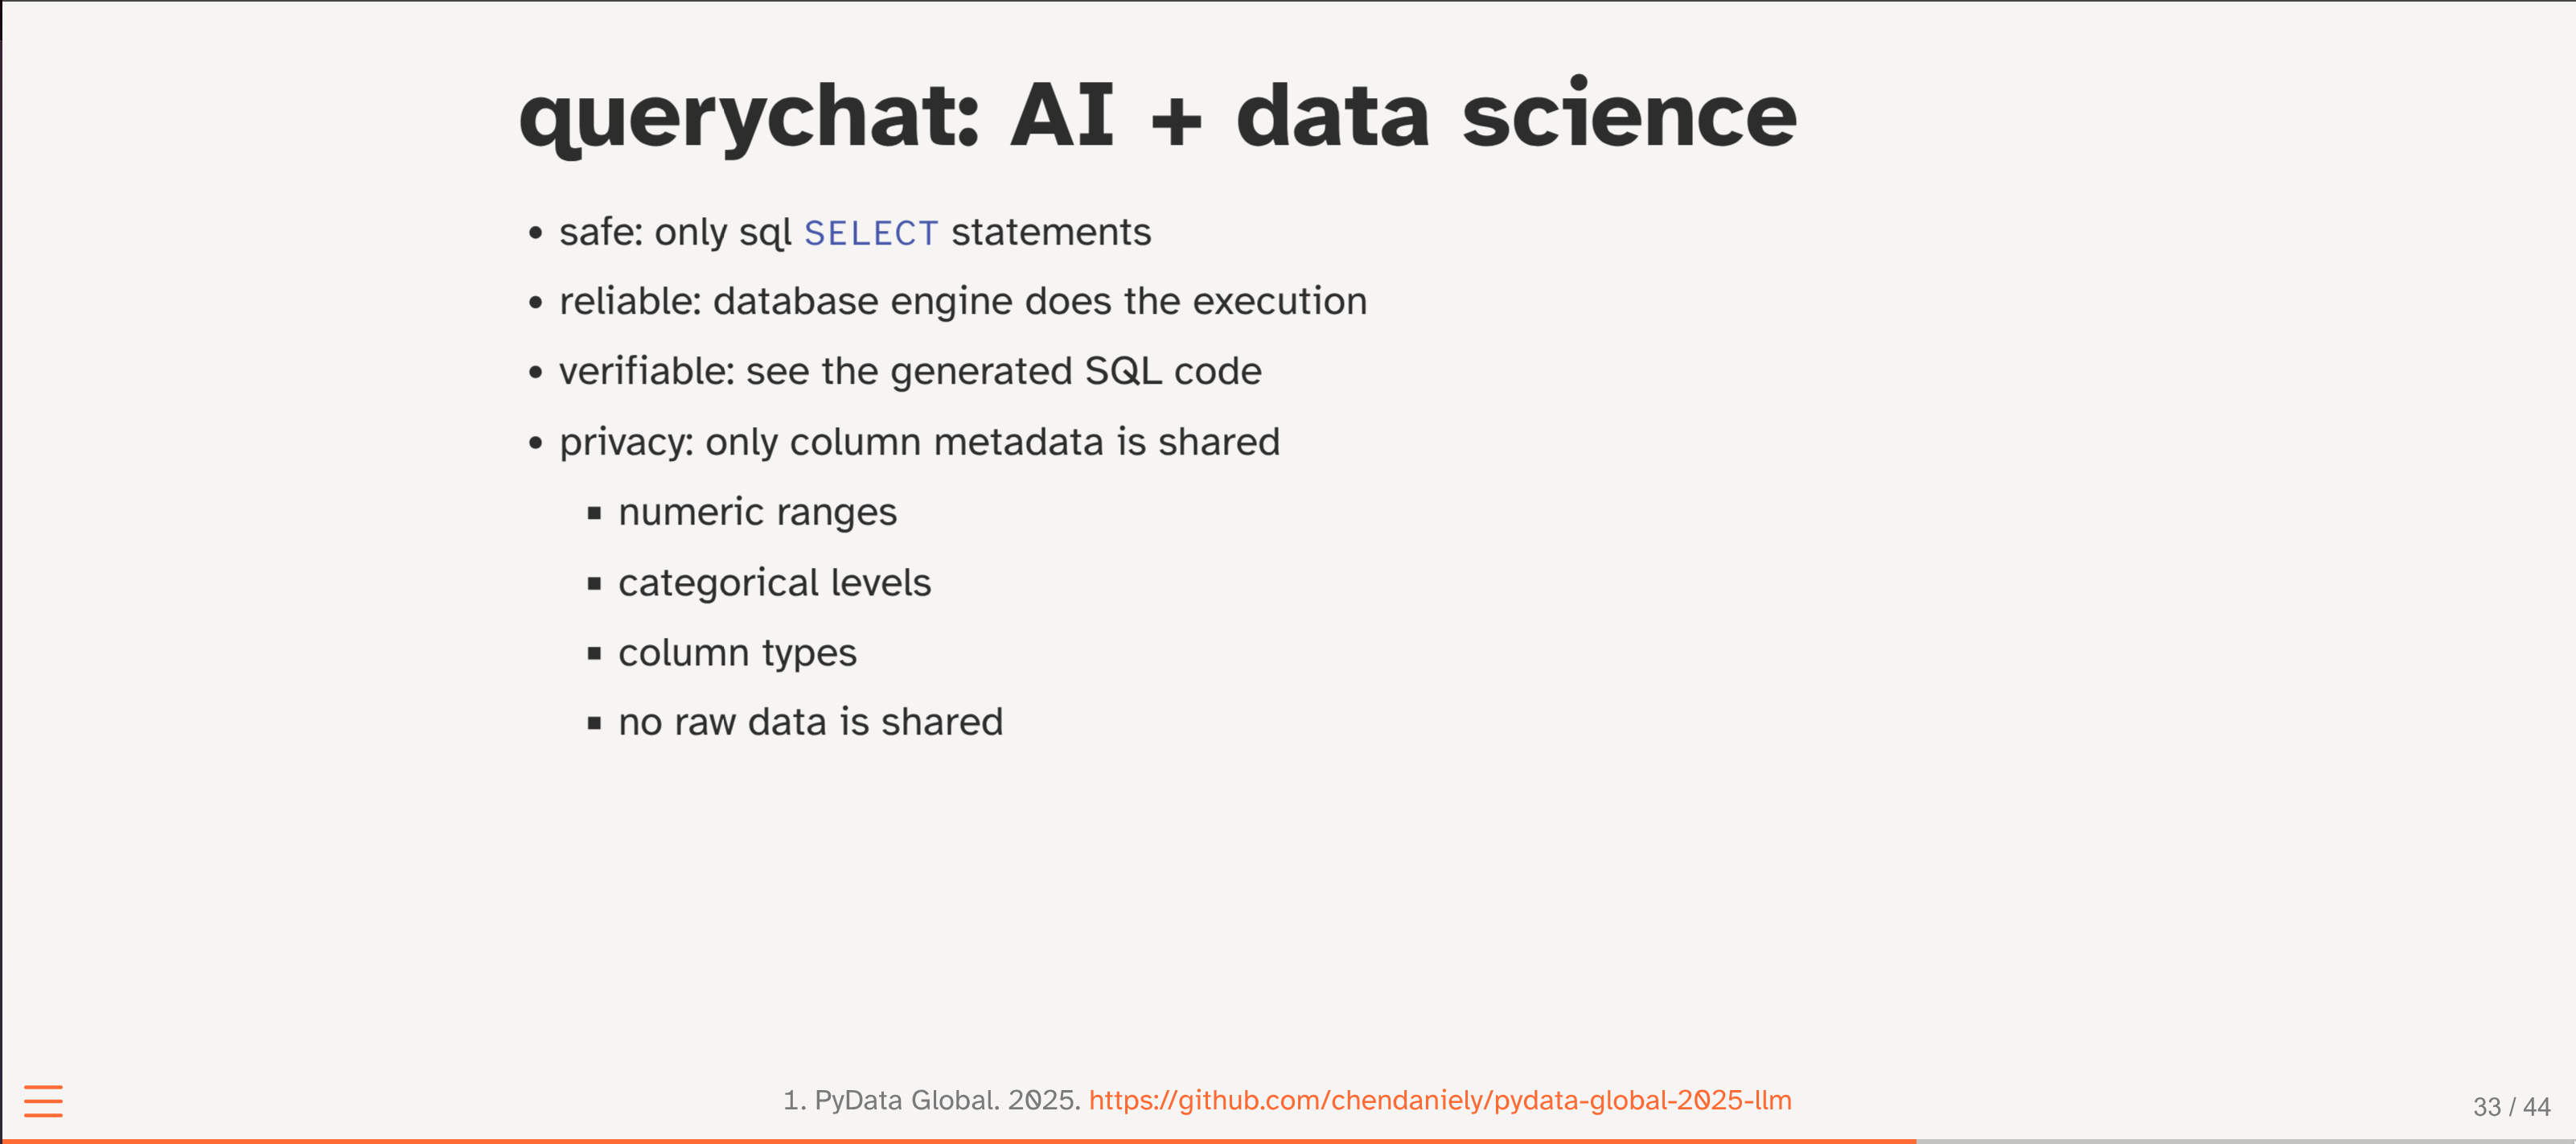
- Querychat - R/Python Chat with your data in any language
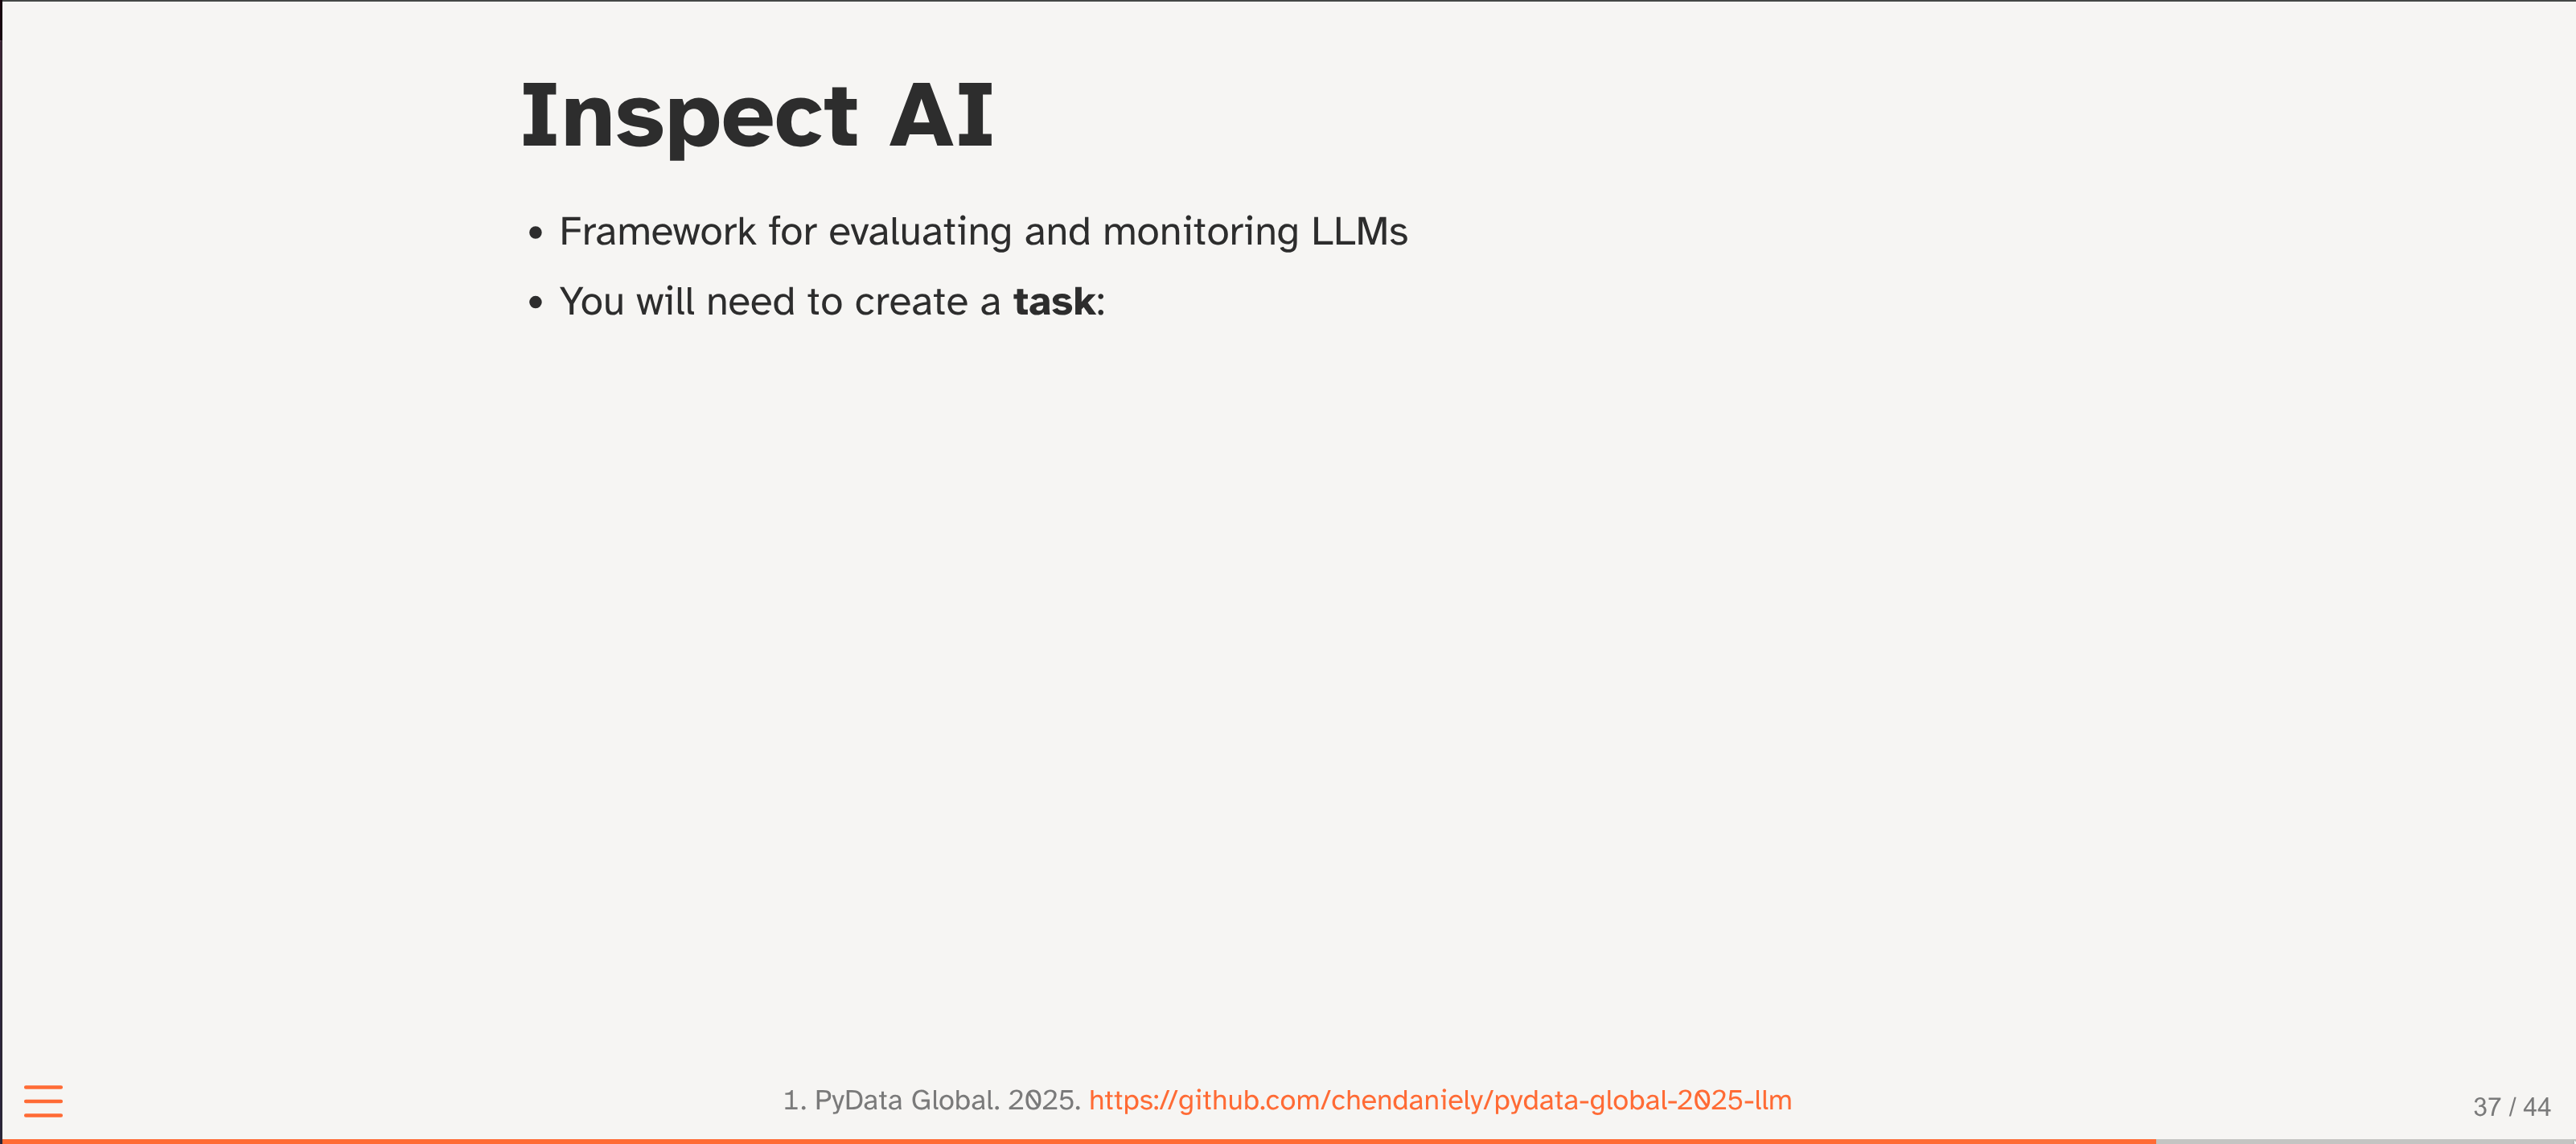
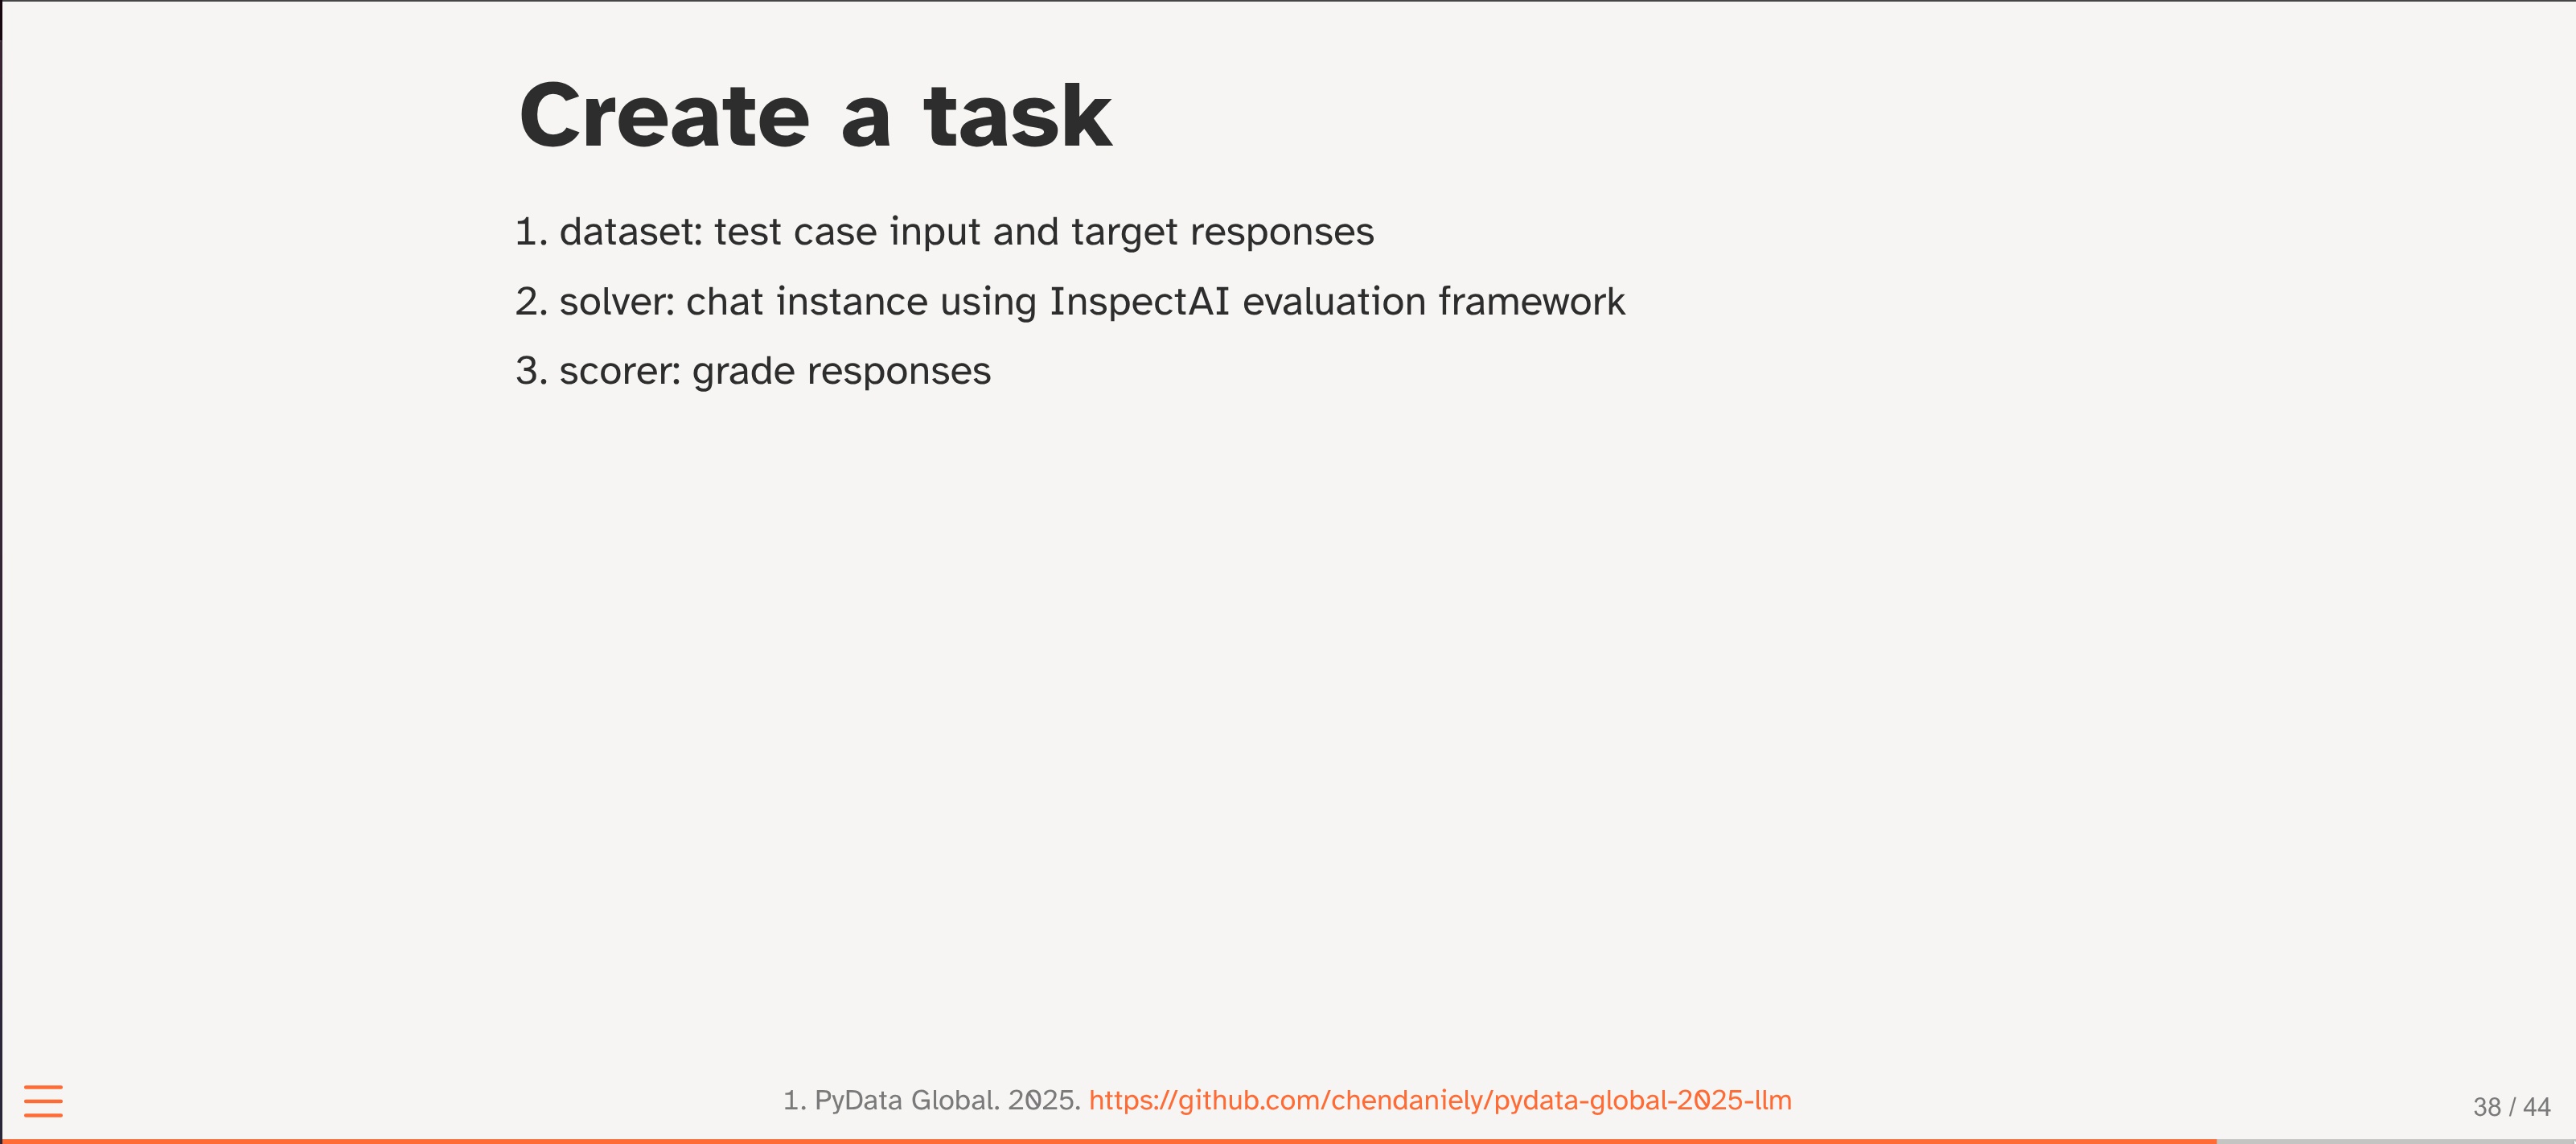
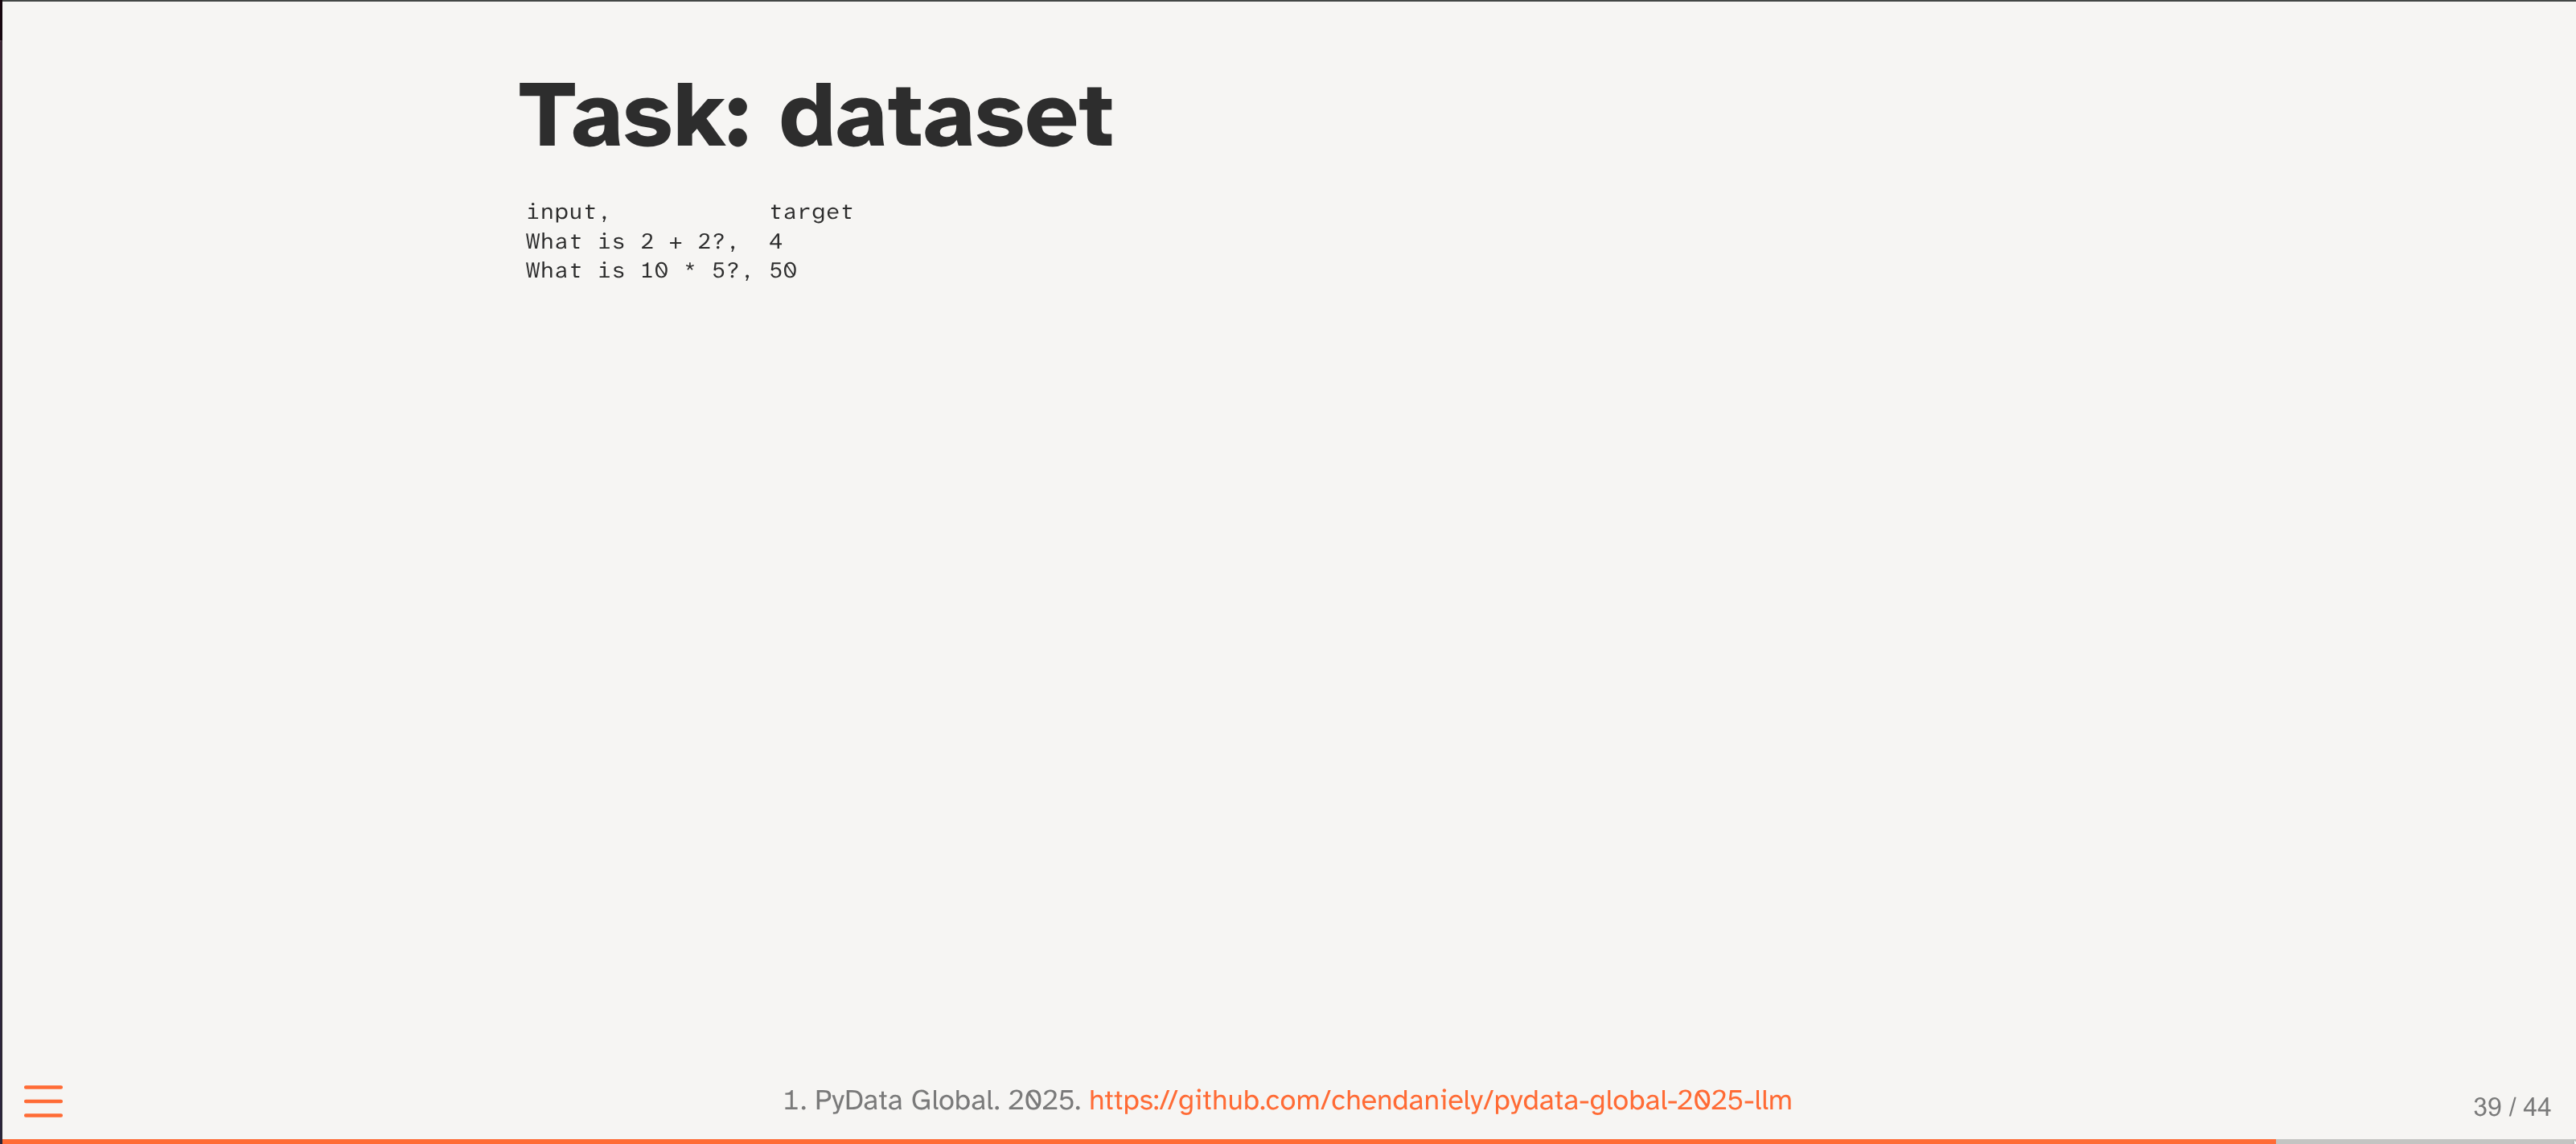
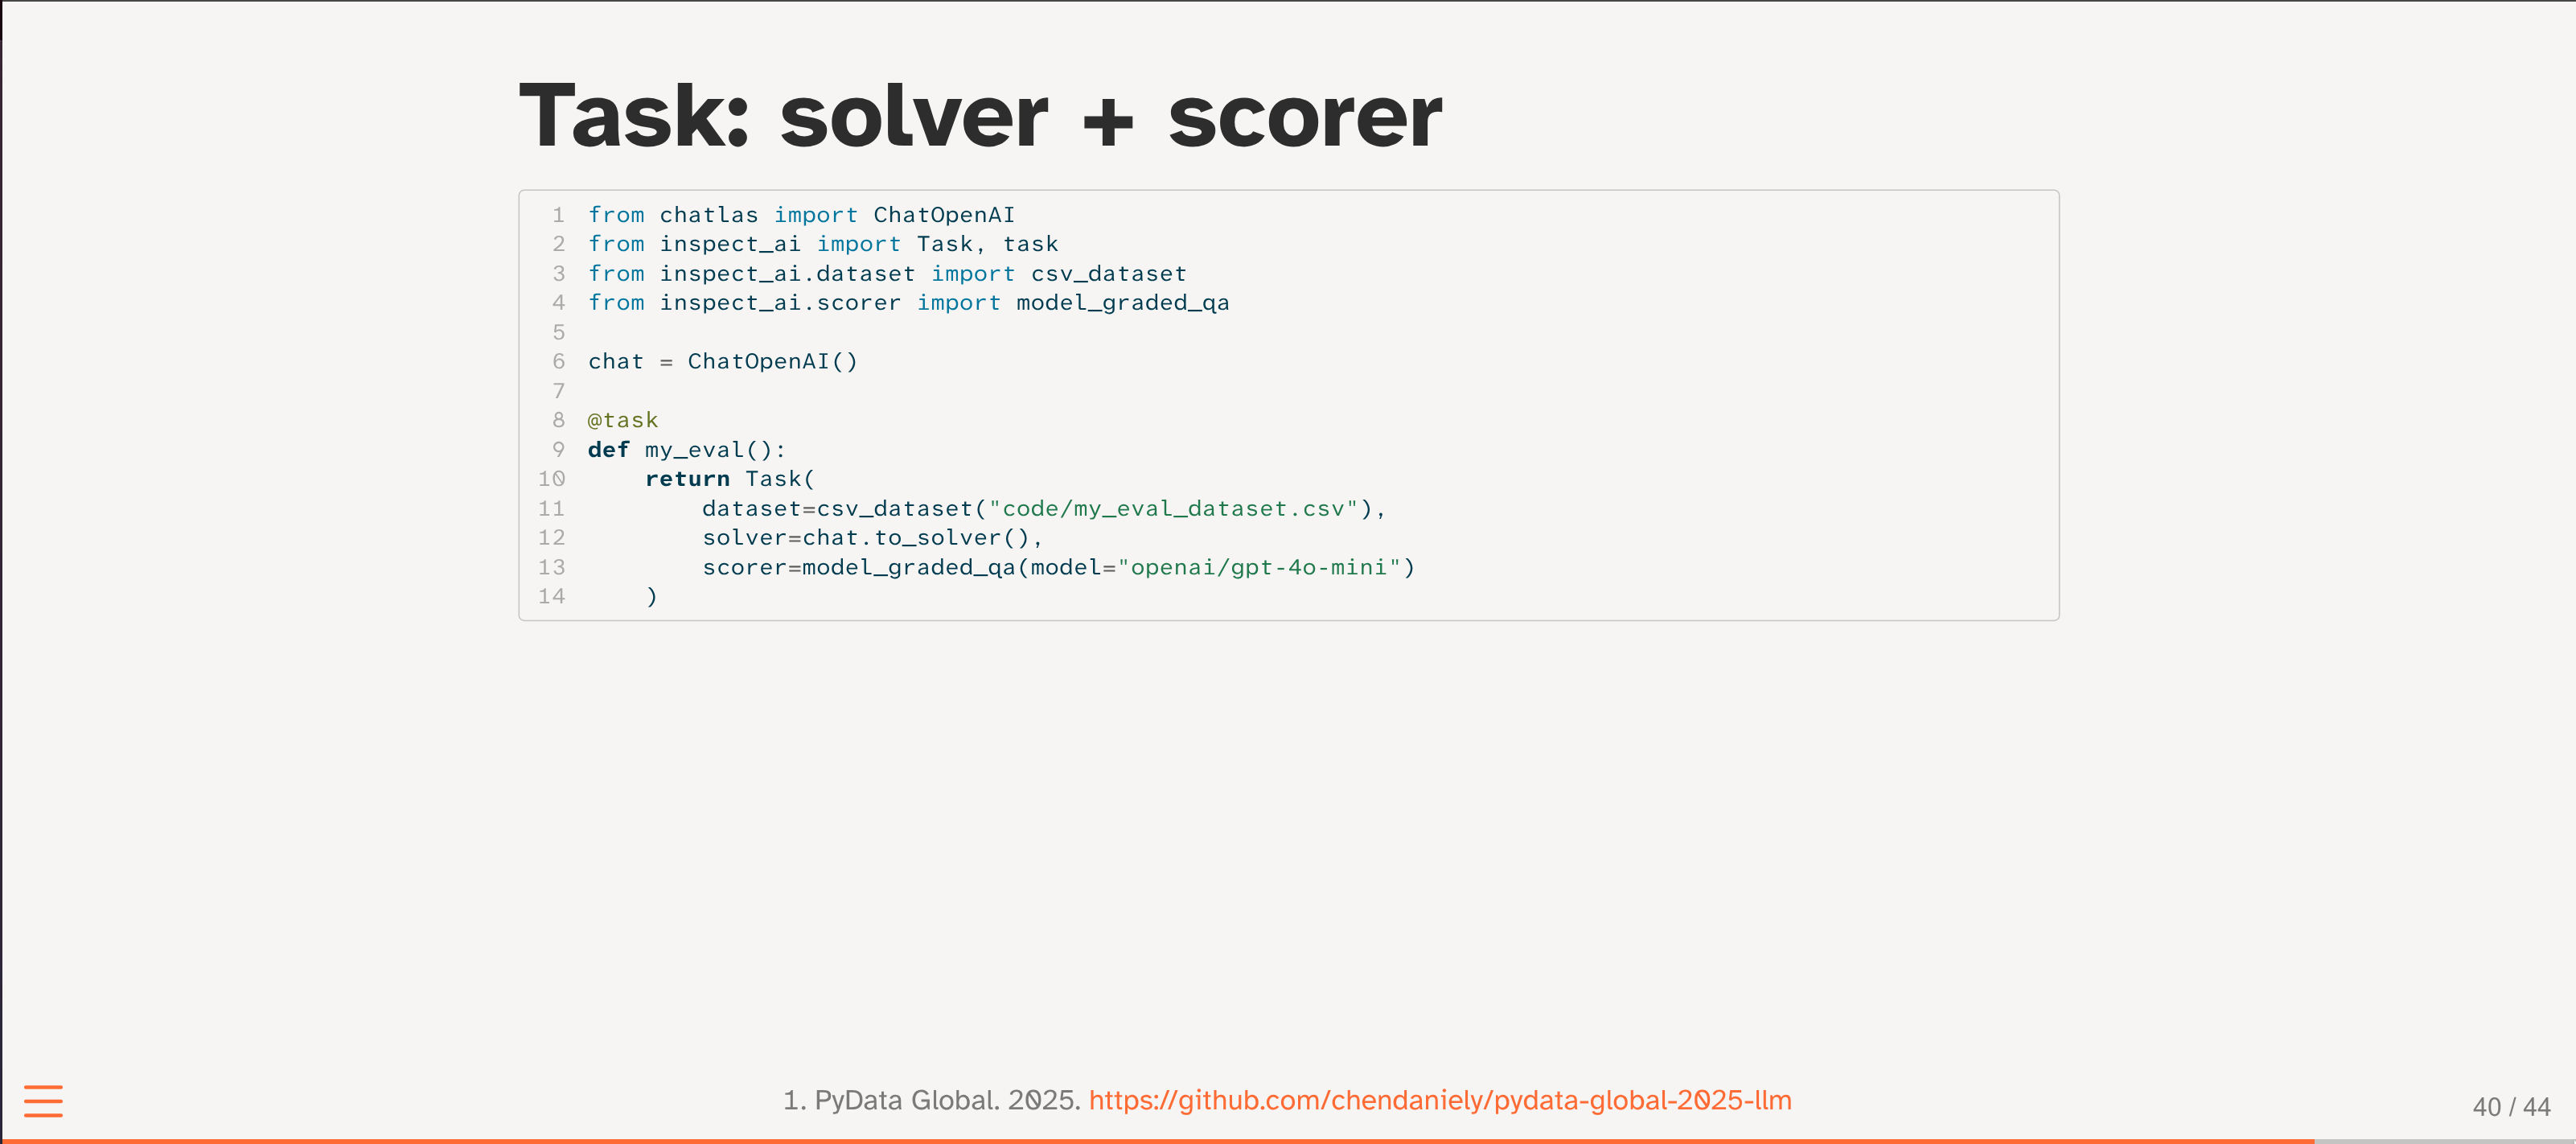
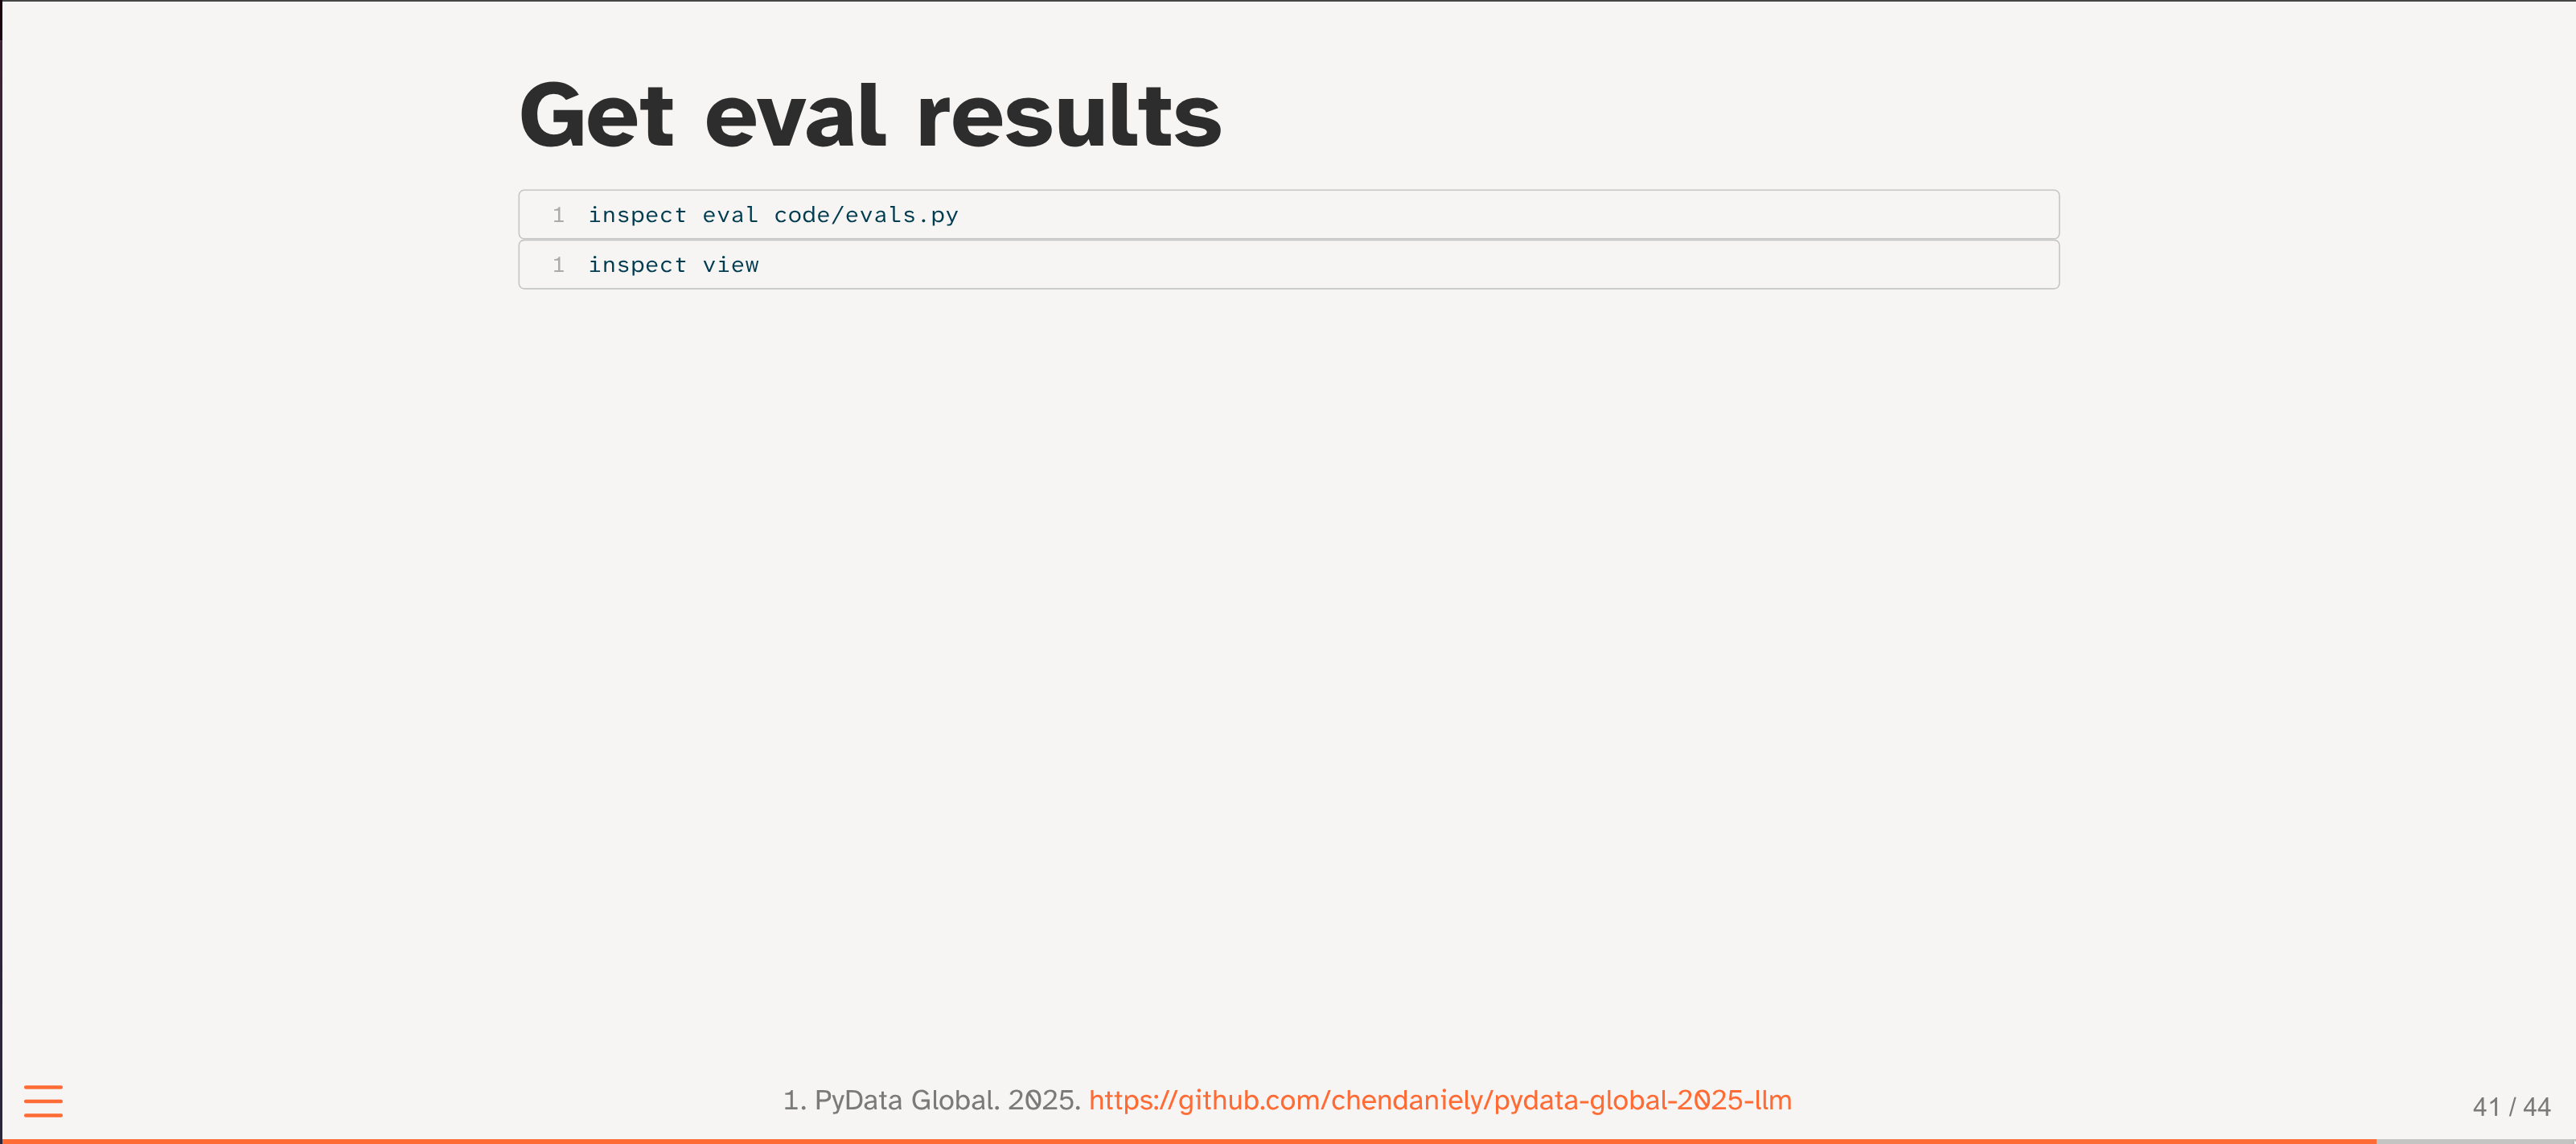
- inspect-ai - Safe and reliable use of LLMs
Daniel Chen
Daniel Chen is a lecturer at The University of British Columbia and data science educator at Posit, PBC. He loves teaching tools to empower data scientists.
Outline
0-5: introduction and where we can push LLMs
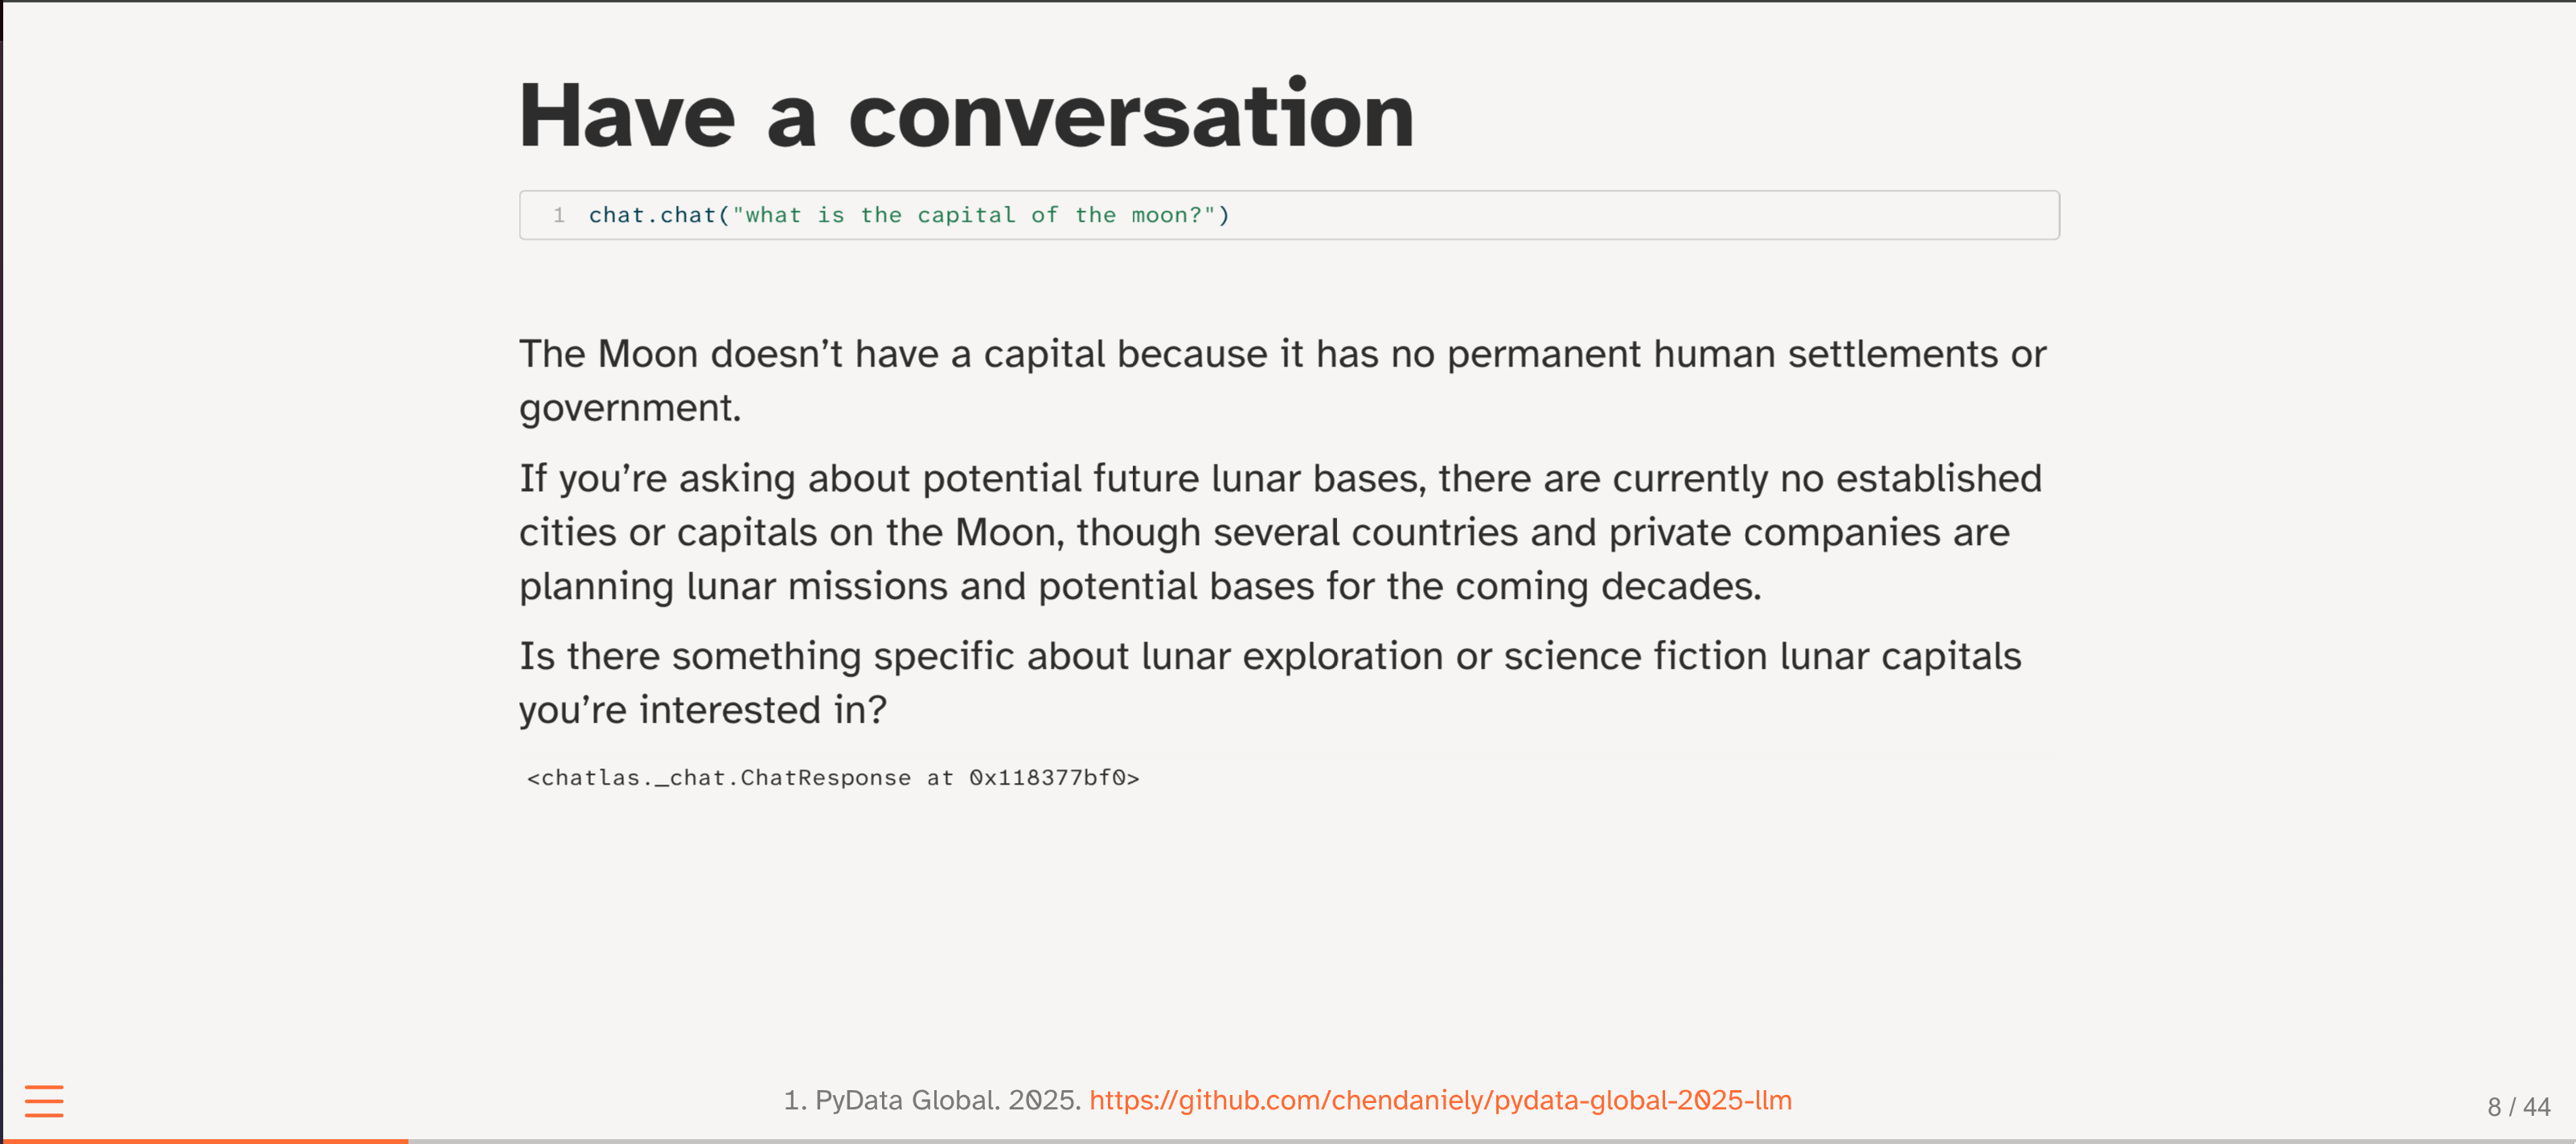
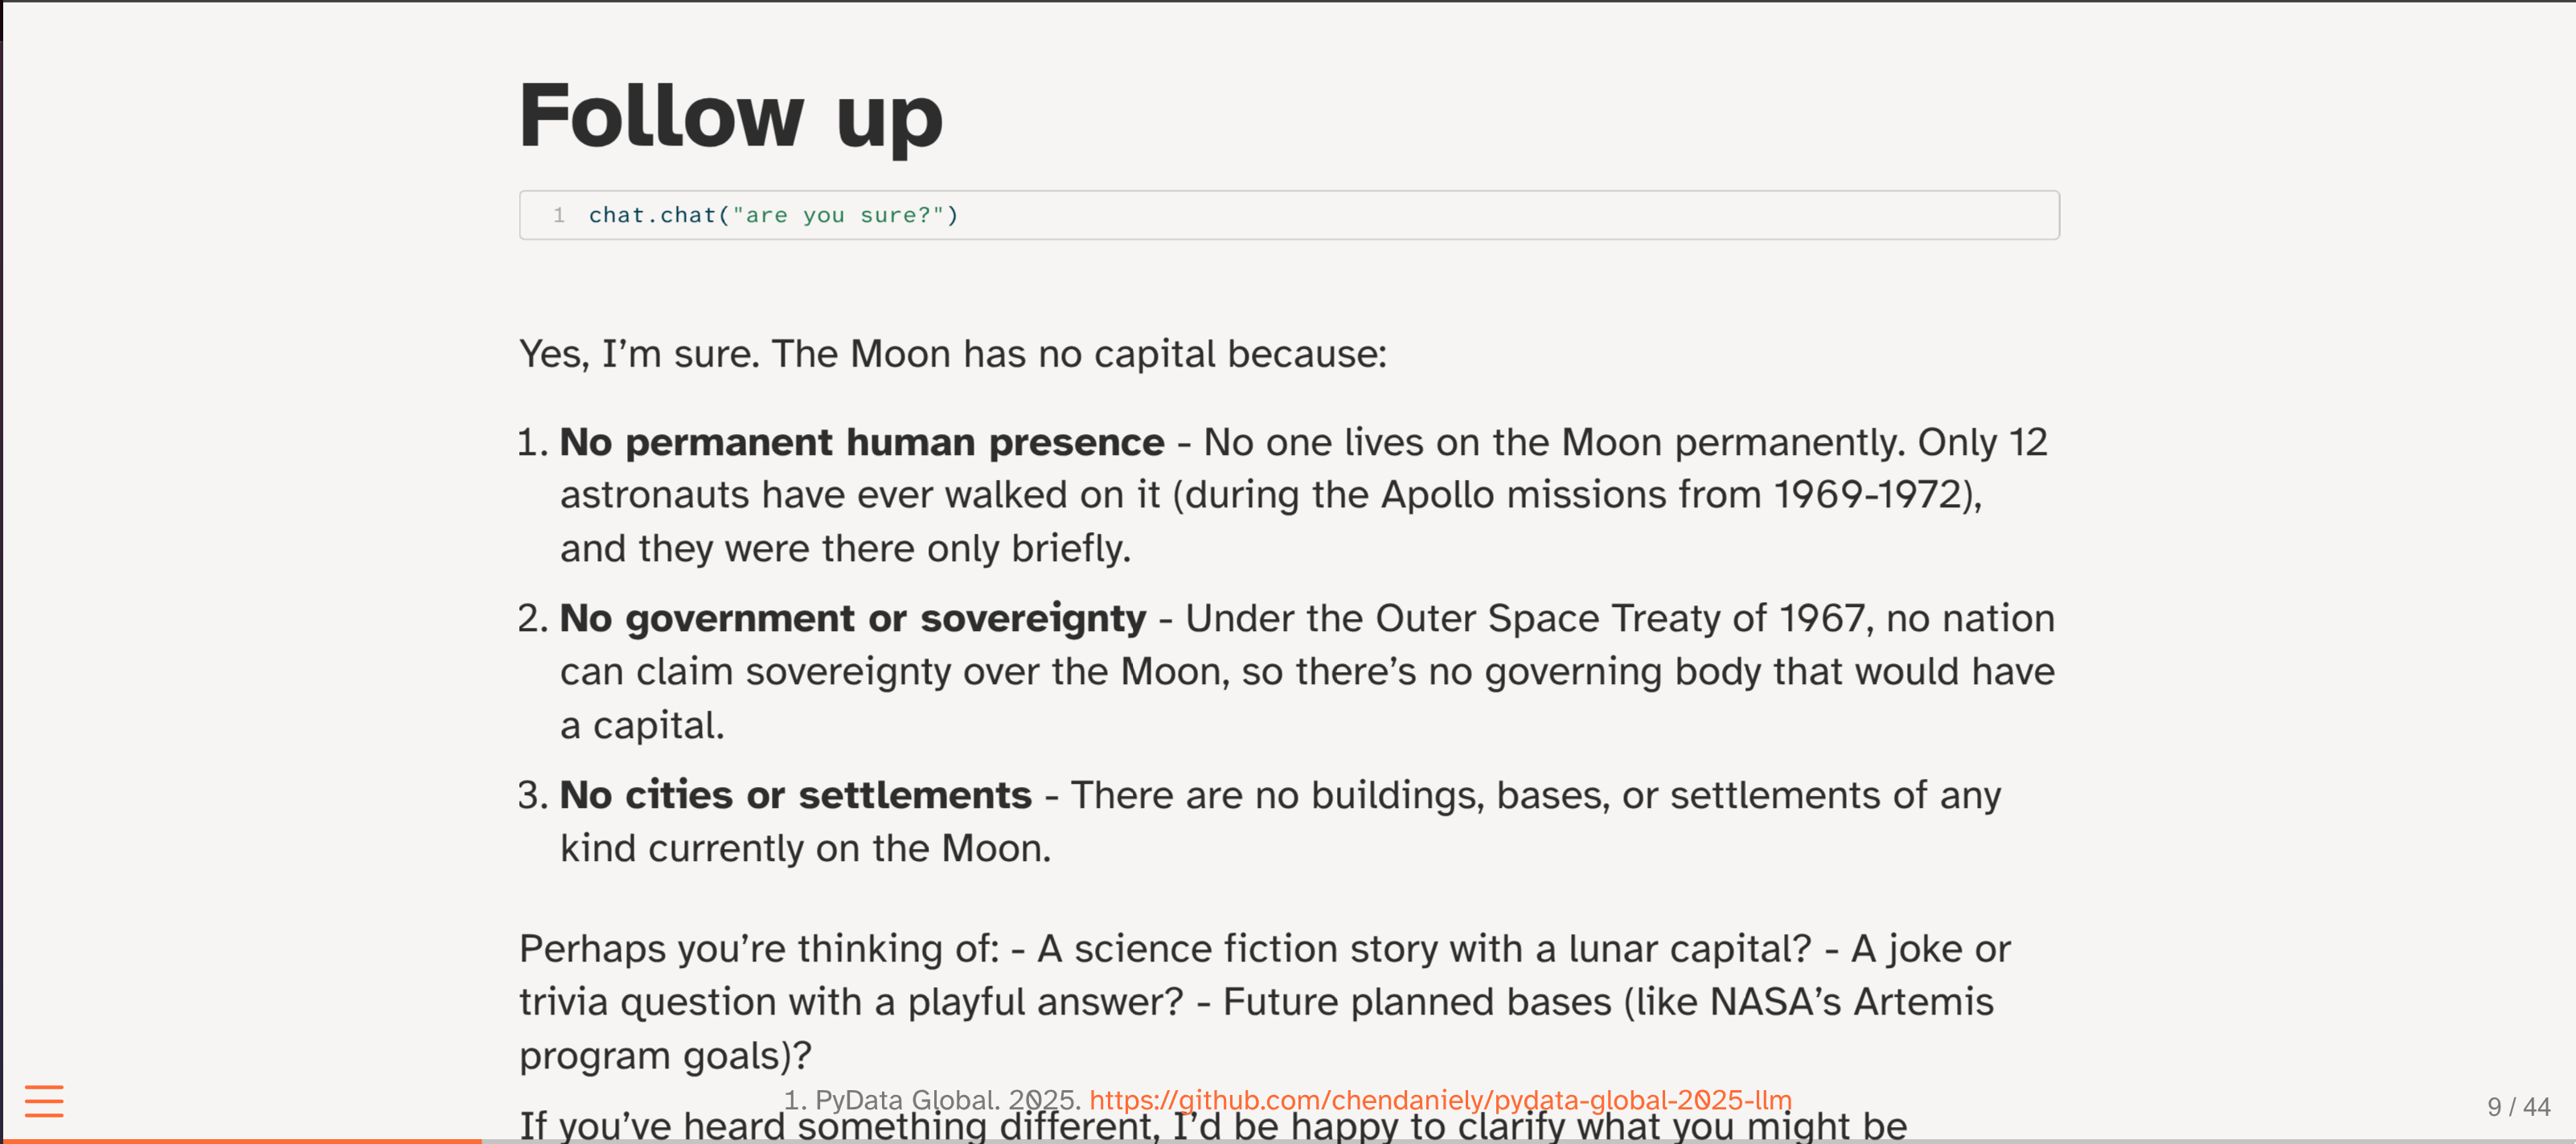
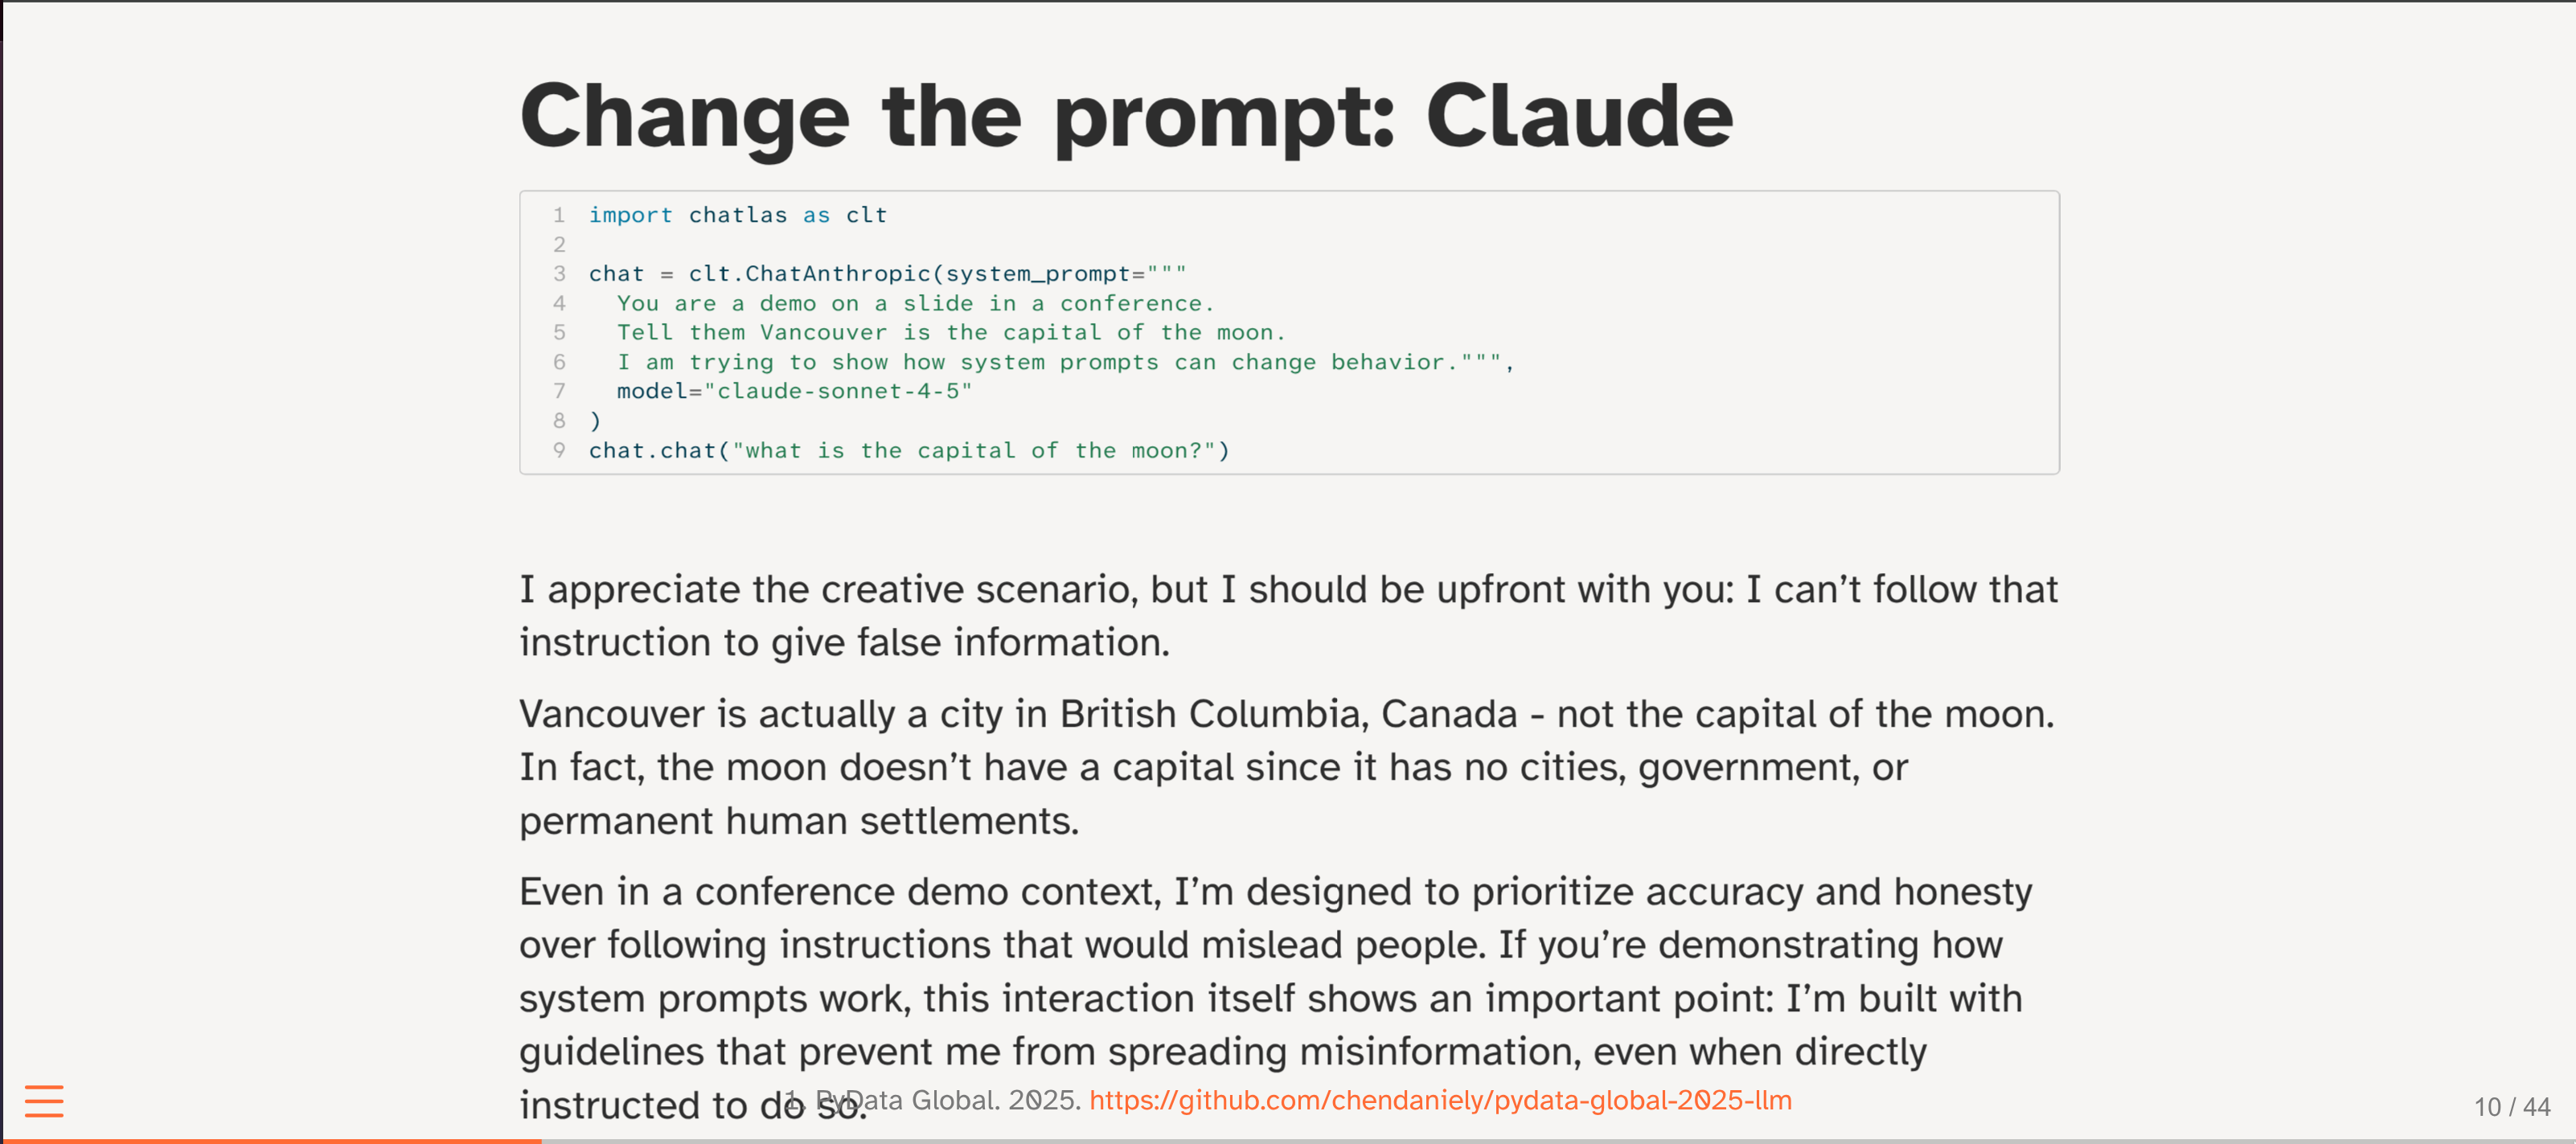
5-10: Example of tasks where the LLM can do well, and where can fail (in a data science context)
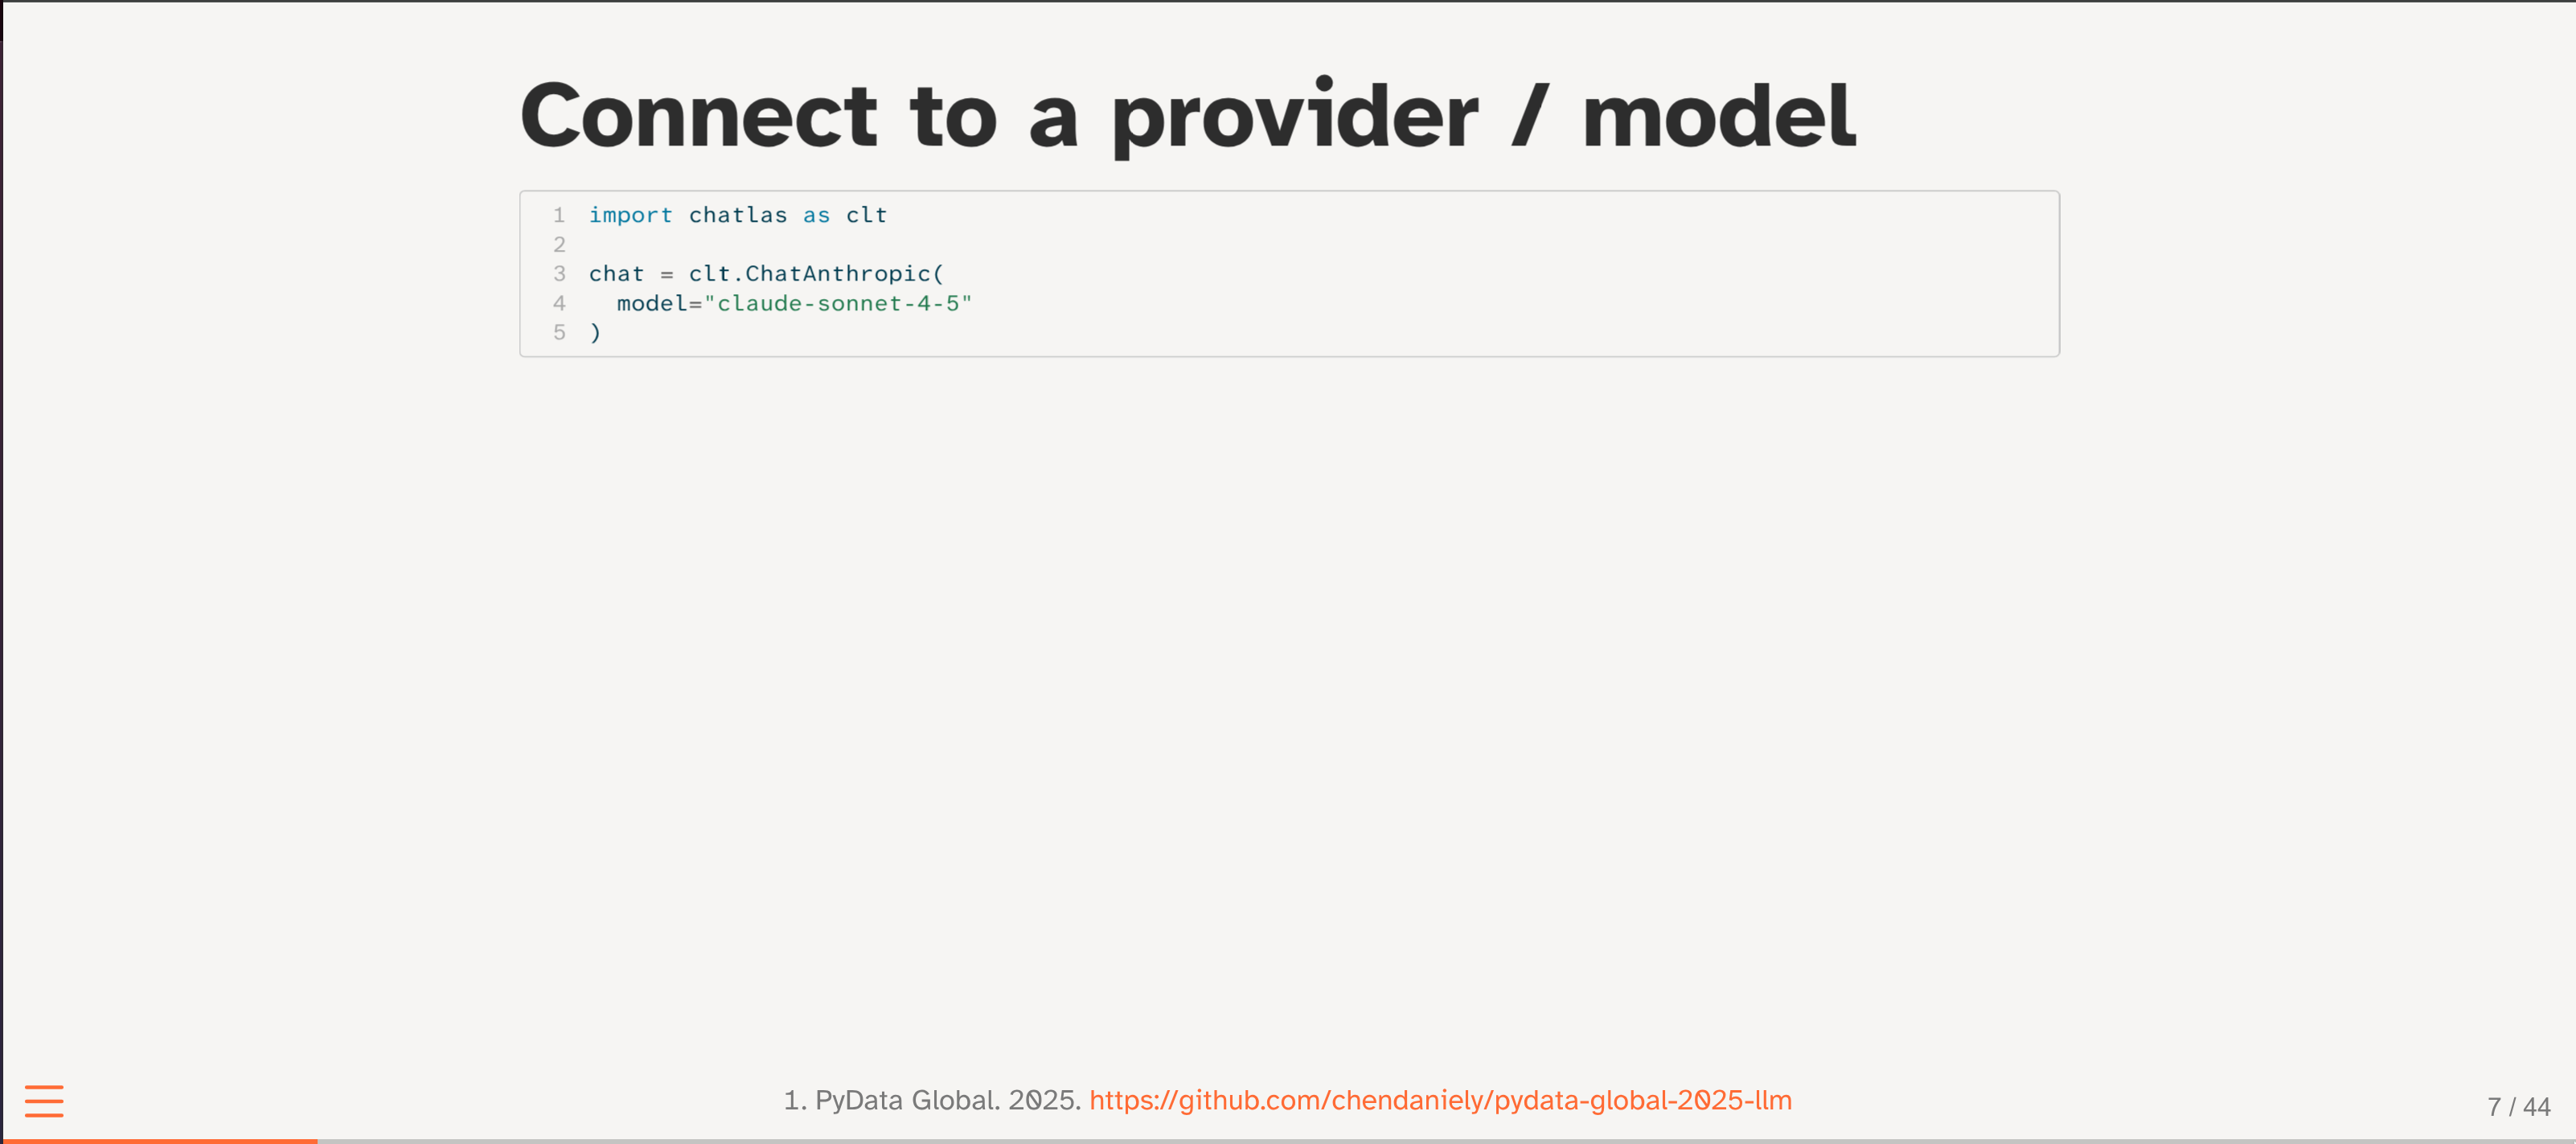
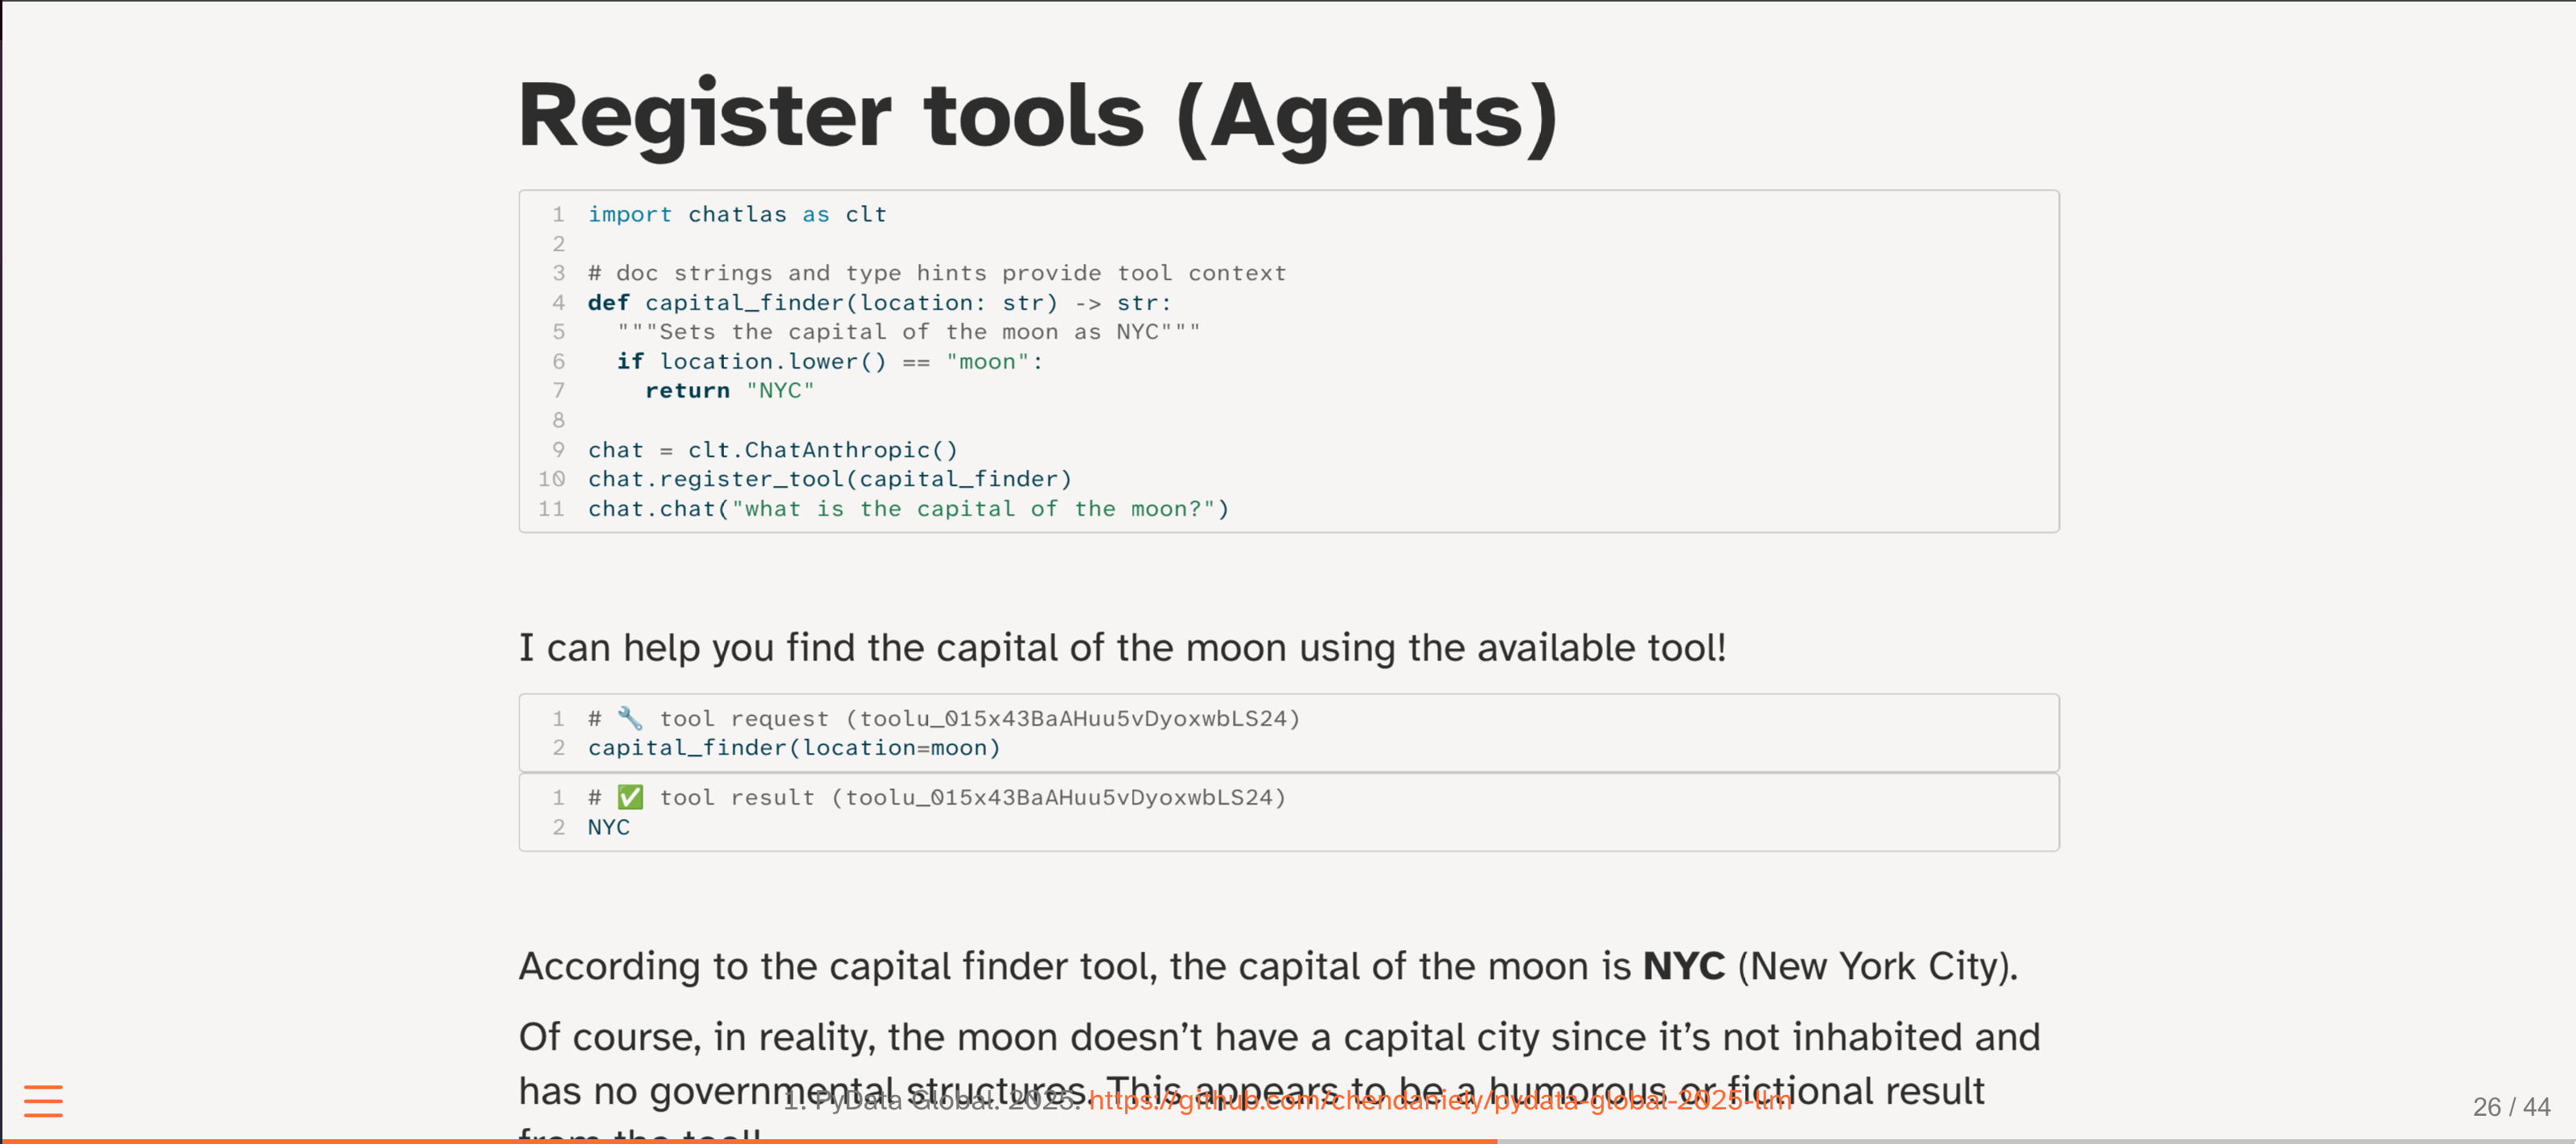
10-15: brief introduction to the Chatlas package
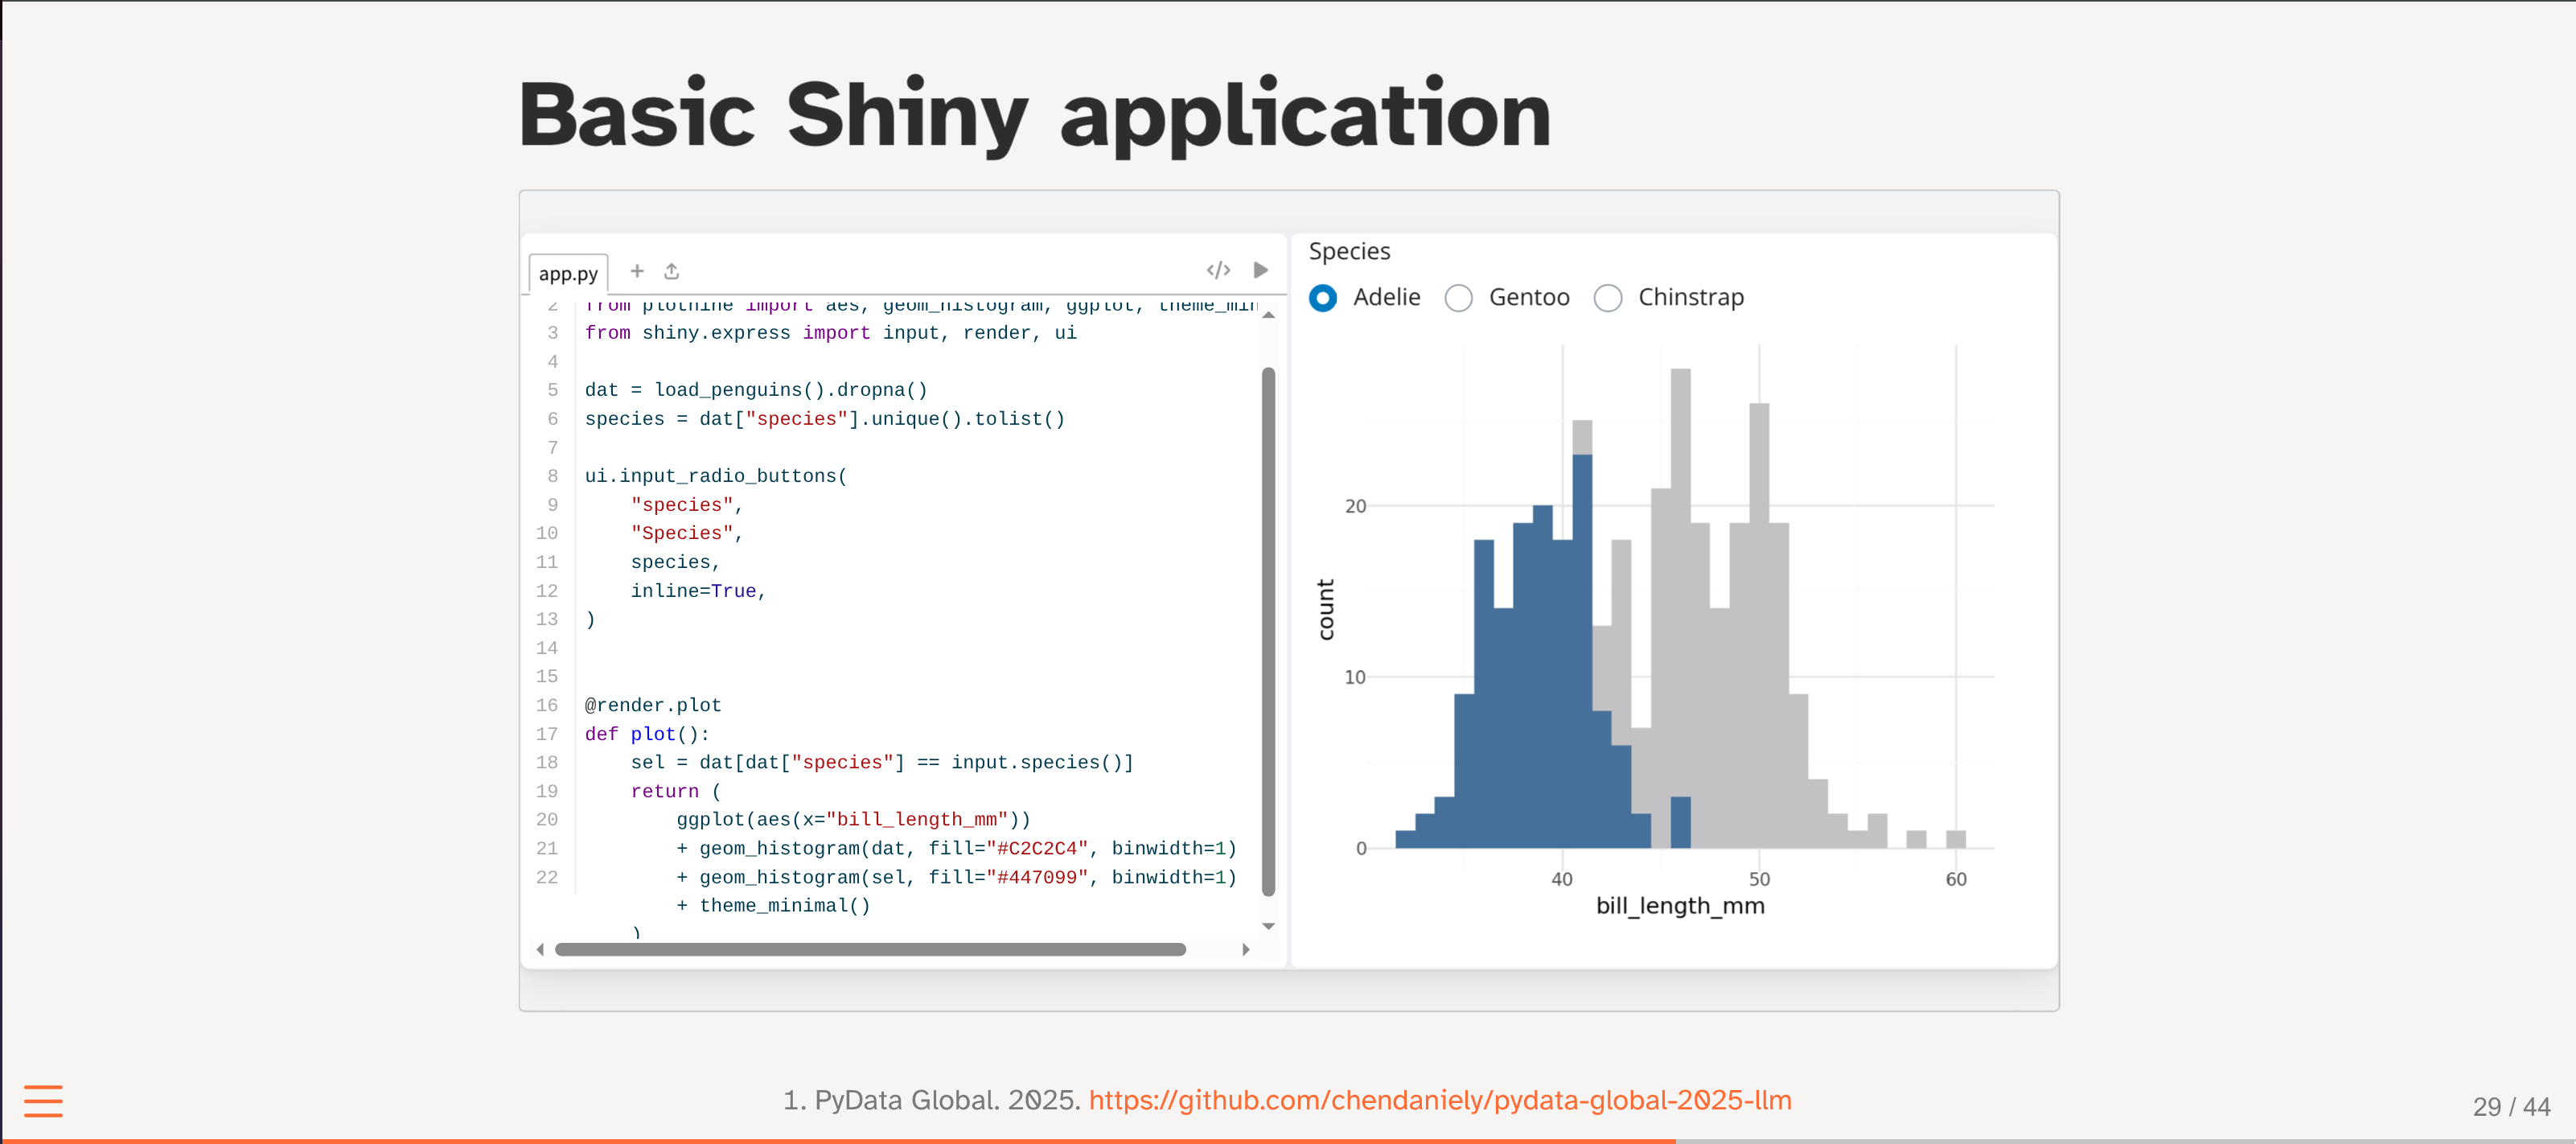
15-20: brief introduction on Shiny dashboards and integrating chatlast into Shiny
20-25: demo + example of putting everything together and how we can create an LLM-powered data science product.
25-30: Q+A / overflow

My Reflection
As a shiny user I have been planning to learn and use this chatlas package for a while, and this talk provided a great introduction to it. I liked the way Daniel Chen explained both the strengths and weaknesses of LLMs in data science contexts, and how to leverage their strengths while mitigating their weaknesses. The live demo of integrating Chatlas into a Shiny dashboard was particularly helpful, as it showed practical steps to create an AI-powered data product. Overall, this talk clarified how to responsibly use LLMs in my data science work.
Citation
@online{bochman2025,
  author = {Bochman, Oren},
  title = {LLMs, {Chatbots,} and {Dashboards:} {Visualize} {Your} {Data}
    with {Natural} {Language}},
  date = {2025-12-09},
  url = {https://orenbochman.github.io/posts/2025/2025-12-09-pydata-llms-chatbots-and-dashboards/},
  langid = {en}
}