TLDR
While it is not a forgone conclusion that CRO driven by A/B test will be a major disaster but it is likely that without some expert supervision it can end up a costing more and taking longer. The statistical concepts are not fairly basic but most of them are misunderstood. 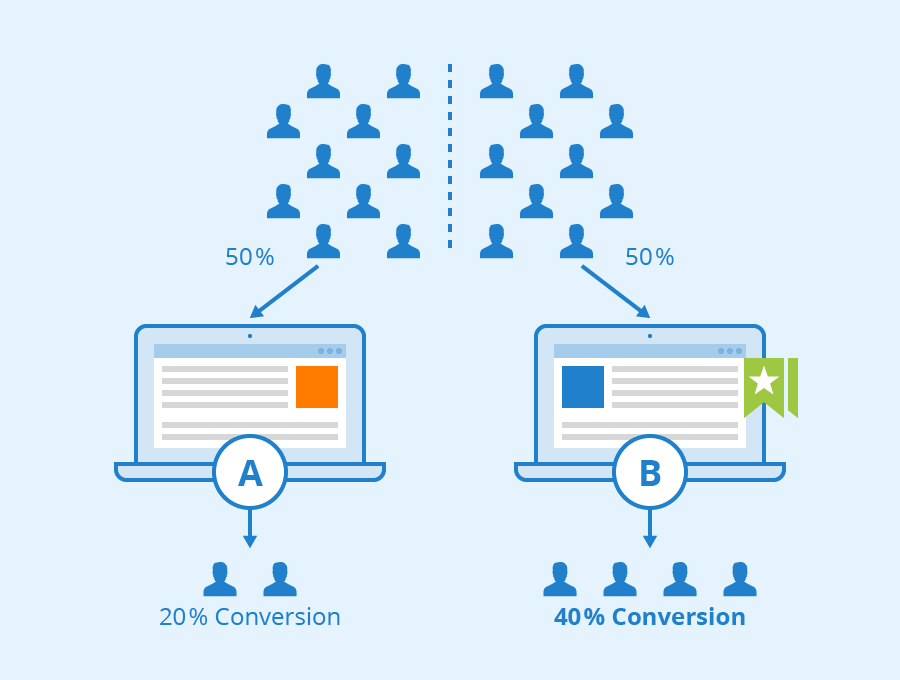
Introduction
A/B testing is the preferred gateway activity for marketers and SU interested in becoming more data driven. Setting up A/B test can be really easy but if I may paraphrase Shakespeare’s Hamlet “therein lies the rub!”. The problem is that the challenges are in knowing when the test has ended and how to interpret the results. And even when things seem clear cut a test can give you bad results say once in twenty times. And at the bottom line is the cost of failed test and bigger costs in money and confidence when advising decision makers to take the wrong conclusion they should be taking.
So when you do test that can make a big impact to your business make sure that you have a committed scientist keeping an eye out for any errors.
What are the cost of A/B testing ?
Setup costs
You generally need to pay a developer to code the alternatives, and to setup the code that does the the sampling and book keeping. An IT guy to deploy it and an analyst or data scientist to analyse it and then a marketing manager to decide to take some action (ok the intervention and decide to do more testing.) ## Exploration costs and diminishing return When we want to romanticize researching a new intervention we call it Exploration and then we use the less romantic term Exploitation to refer to making using our current best intervention to get outcomes from our web marketing efforts. A/B tests shunts a percentage of you traffic (often 50%) for the duration of the experiment to an intervention we call B we expect to beat out current best effort which we call A. But since pretty smart people chose A it can take many attempts to find a B that better. Also each time you find a better alternative it get harder and you end up getting smaller improvements this is due to what is called a smaller effect size for the intervention. Consider that you will eventually get to an optimum and need to look at a different strategy to make improvements. The good news is that each time your exploration works out and you get a better outcome the test will end up driving up your kpi and goals. But the bad news is that most of the time you wont be getting a win and conducting the test will cost you in lost action. Most A/B testing platforms can track your goals and will try to minimize the negative impact of the test using power of Bayesian statistics. You should make use of these if they are an option. But if you are getting started you might not have the benefit of integrating this type of stats into your experiment. Also even the amazingly capable people who build these tools can get it wrong and have had to rewriting their systems. The main reason that testing has diminishing returns is that you it is much easier to test for big changes early but small subtle changes which have small effects take longer to achieve statistical significance because we are trying to separate two very similar signals coming from A and B. Each win generally means that the next test will take longer be less likely to be a win and therefore cost more on average.
As the are usually diminishing returns from running A/B test. If your landing page has a low conversion rate, say 1.5%. You can do experiments and you might be able to reduce bounce rate by 40% percent which should increase your conversion rate to 1.2%. Next you might be able to increase time on page by 300% using better videos that might boost your conversion rate to 3.5, your might be able to pick a more effective cal to action and get around to 3.7% conversion rates. And you might also add an aggressive exit popup and get to 4.2%. That is a dream scenario that CTR consultants dream about. But if your are not working in a startup and you have a solid marketing team you will probably start with many of the choices near optimum and end up at 3% conversion rate. And each successful test will give you a .1% improvement. That might be ok but such a small improvement will take much longer to reach significance and therefore end up costing more. With all the test you ever do you might never reach 4% Over time you should expect that A/B test will be measuring ever smaller effects and will require more traffic to arrive at a statistically significant result. Longer test will cost more.
Agility and temptation of ending early.
“Temptation is the devil looking through the keyhole. Yielding is opening the door and inviting him in.” – Billy Sunday The analytics of A/B Testing can show partial results from the very beginning. It is tempting for decision makers that are incurring costs to make their decision early. It is more tempting when it supports their own beliefs or preferences. With some luck it is possible to establish that a winner is emerging and with a large margin. But this is where the effect in the B intervention is much stronger than in A. The problem start when with smaller effects we will tend to get a situation similar to a closely tied election poll, where partial results in an A/B test can inspire false confidence in the losing candidate. The papers and even the candidate may be inspired to claim victory and have a rude awakening the next morning. In Testing making a decision means we end the test as well and move to the next hypothesis but the problems will we that we picked a loser and are now a step further from the optimum.
- If you end the test to soon or too late you may end up drawing the wrong conclusion and end up incurring a hit for 100% of your traffic after you make the wrong intervention.
- If you work with a 95% confidence interval you will make a mistake in 1 out of 20 tests. Using a 99% confidence interval will reduce it but will protract your tests subjecting you to a much slower optimization process and the greater cost. It can be very challenging to know how long an A/B test should run. But it is possible to get partial reports and it these can give different recommendation at every step. af and before it reaches completion the outcome could If you run it less you Let’s list some issues that when arises. Touted as a optimization technique A/B testing cannot be used to optimise cases where two factor when their interaction creates negative value. Perhaps a more significant problem is that without a good assessment of effect size and success and failure rates figuring out the stopping criteria cannot be established. To try to estimate these one needs so called AA tests. Try selling some A/A test to your client or better yet to your own media team whose marketing tools penalize cny change to their campaigns campaigns and who view mosts tests as damaging to their performance. If you skip these you can’t really know how many trails will be 95% certain you are correct. And if you decide to skip these you may certainly to have a random test result and likely as not you will never even know it. However, since I don’t plan to discuss the failing of the ab design but rather propose an alternative design goals… The first issue is that we are not interested in finding a global maximum. A global maximum is the one size fits all solution but this is most certainly a compromise. What we wish to do is run an experiment that identifies segments and a feature set which produces the optimum for each segment. We want to arrive at this solution fast, with confidence and with minimal impact on cost due to the experiment. For extra point we would want a best estimate for the impact of early stopping of the experiment at any given state. (So for unevenly sized segments we might be ok to stop the test with ok results for the larger segments and identifications of the smaller segments which would allow a second focused experiment to be perused ).
Additional challenges:
- Your sampling script may be biased or may introduce a bias. Usually it may slow things down or act up in some older devices. This will usually only effect the B branch and will act to reduce its success rate. Since effects being investigating are small 5% slow down would easily mask signals that are smaller. Slow down are not the only issue but the leading problem when dealing with large volume traffic tests.
- You may not putting the returning visitors in the same A or B buckets from before. This is going to mess up your samples. If there are many repeat visitors you will invalidate your test. This is handled using cookies and many web crawlers will discard cookies.
- Your A intervention may have high variances in its performance. The bigger the variance the longer it will act poorly and then catch up. If this is the case one should take great care not to finish early. We should increase the test’s confidence intervals from 95% to 99% and this will require bigger samples and longer test.
- The test needs to reach statical significance to terminate but it also should run at least for a business cycle otherwise it will introduce an unwanted bias into the test. You might detect that a certain call to action works really well during the weekend but perhaps it is not so great during the rest of the week.
- Bad luck can lead a test reaching significance at its start if the B branch a sequence of conversions and while the A branch does not. In these cases the test should continue and the outcomes will correct themselves. The correction can take longer if the test is the using Bayesian stats to to reduce testing costs. In reality judgment should be suspended in the early phases of the test. Some software might stop the test early and you want to avoid it in such a case. (With enough test bad luck is something that happens all the time but at a small percentage of cases. )
Terminology
- Bayesian statistics
- an advanced shool of statistics which can produce valid recommendations with small sample sizes.
- Split test:
- another term for an A/B test
- Type I error
-
Rejecting the Null Hypothesis even though it is true (declaring an effect even though it doesn’t exist). The P-value is also the probability of a Type 1 error. The level of
Statistical Significancein use is the probability thatsignificantresults are not a Type 1 error.
- Type II error
- Accepting the Null Hypothesis even though it is false (not declaring a real effect). Statistical Power reduces the chance of committing a Type 2 error.
- \alpha
- The Alpha value is the maximum limit you allow for the probability that your results are due to chance. For example, with an Alpha value of 0.03 (or 3%) you know that your results would be due to chance in fewer than 3% of cases. An alpha value of 0.05 is conventional within AB testing statistics.
- \beta
- The Beta value is the probability of a false negative. The probability of identifying an effect when one exists can therefore be formulated as: 100%-b
- Statistical significance
- a threshold that is set for an experiment that limits the chance the outcomes will be due to sampling error rather than the intervention being studied. Typicaly values of 95% and 99 % This looks only at the chance the experiment is invalid and should not be confused with practical significance of the outcome.
- Practical significance
- this is the measure that the effect is
- Confidence interval
- an estimate of the level of uncertainty or error range associated with an unknown parameter like a expected Conversion Rate. As an A/B test progresses uncertainties shrink ideally become narrow enough to completely separate the estimated outcomes. I.E. A’s ctr ~ 4% ± 0.4% and B’s ctr ~ 5% ± 0.4%.
- p-value
- The p-values can indicate how incompatible the data are with a specified statistical model. They are used to decide if we have collected enough evidence in to show that the difference between A and B is not due to a sampling error.
- power
- The ability of an A/B test to detect an effect is known as its Power. It is measured on a scale from 0 to 1. If experiment X has a statistical power of 0.7, and experiment Y has a statistical power of 0.95, then there is a stronger probability that experiment X would produce a type II error than experiment Y. Similarly, Y is more reliable than X because it reduces the probability of a type II error.
Citation
@online{bochman2017,
  author = {Bochman, Oren},
  title = {A/B Testing Cost and Risks?},
  date = {2017-07-30},
  url = {https://orenbochman.github.io/posts/2017/2017-07-30-experimental-design/2017-07-30-experimental-design.html},
  langid = {en}
}