from matplotlib.pyplot import subplots
import numpy as np
import pandas as pd
from ISLP.models import ModelSpec as MS
from ISLP import load_data
from lifelines import KaplanMeierFitter, CoxPHFitter
from lifelines.statistics import logrank_test, multivariate_logrank_test
from ISLP.survival import sim_time

km = KaplanMeierFitter()
coxph = CoxPHFitterSurvival Analysis
We begin by importing some of our libraries at this top level.
Publication Data
The Publication data presented in Section~ can be found in the ISLP package. We first reproduce Figure~ by plotting the Kaplan-Meier curves stratified on the posres variable, which records whether the study had a positive or negative result.
fig, ax = subplots(figsize=(8,8))
Publication = load_data('Publication')
by_result = {}
for result, df in Publication.groupby('posres'):
    by_result[result] = df
    km_result = km.fit(df['time'], df['status'])
    km_result.plot(label='Result=%d' % result, ax=ax)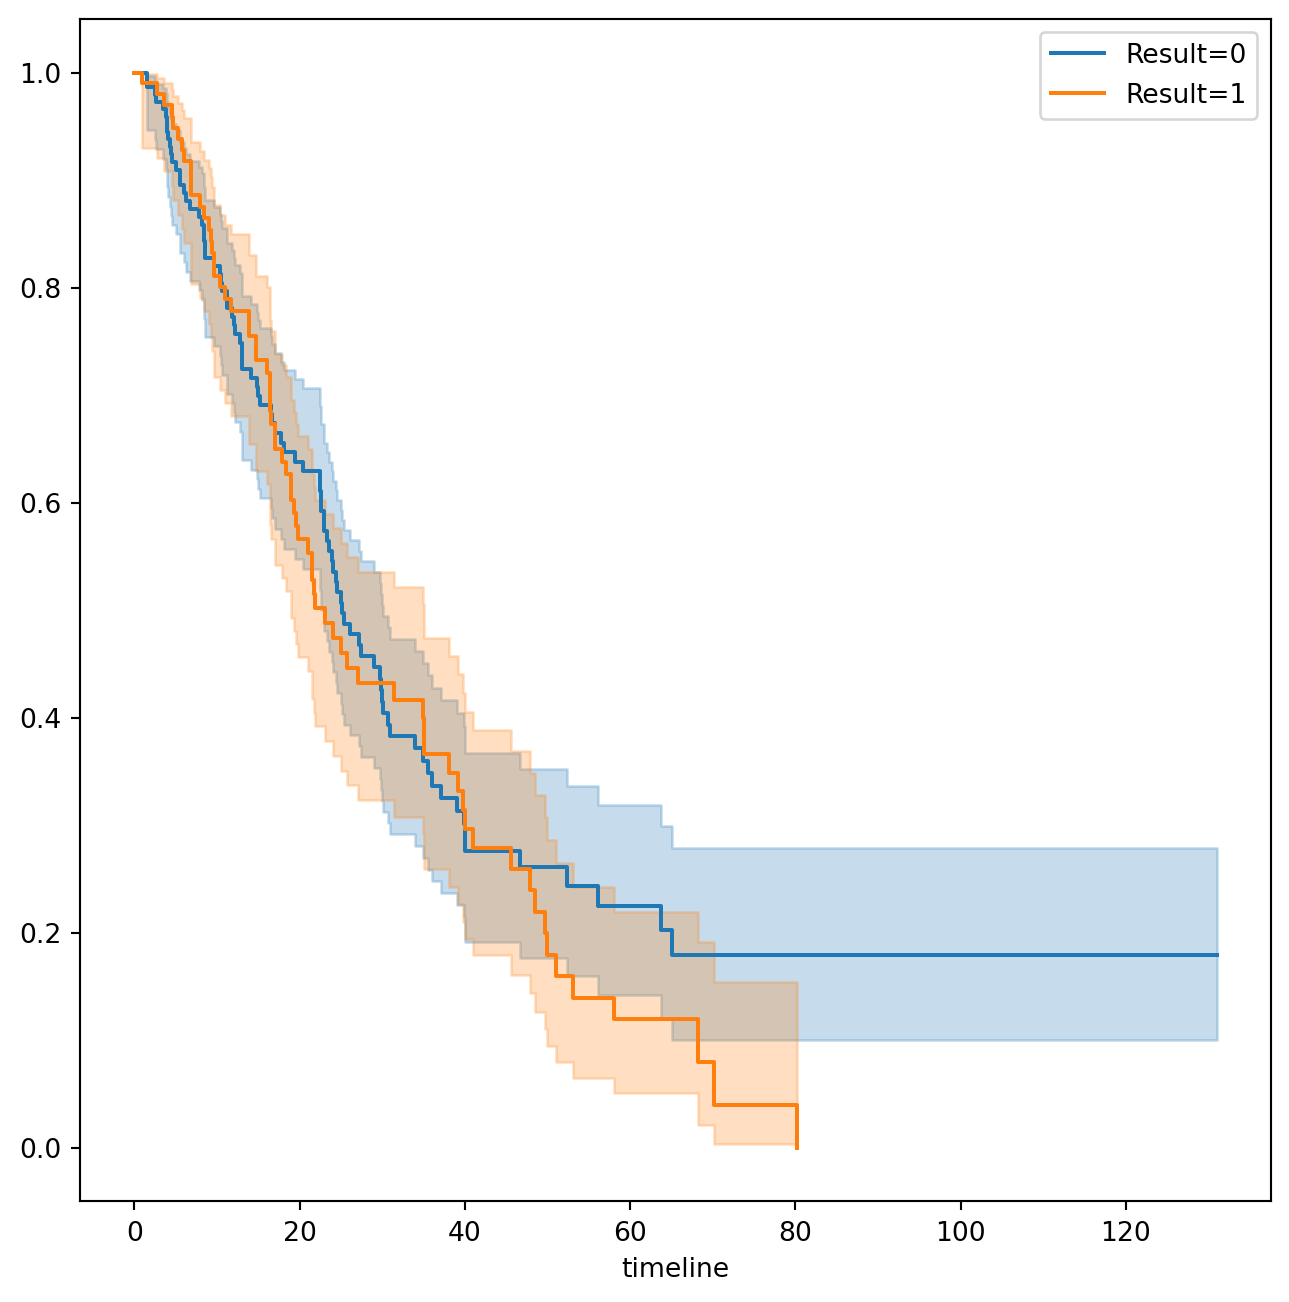
As discussed previously, the p-values from fitting Cox’s proportional hazards model to the posres variable are quite large, providing no evidence of a difference in time-to-publication between studies with positive versus negative results.
posres_df = MS(['posres',
                'time',
                'status'],
                intercept=False).fit_transform(Publication)
posres_fit = coxph().fit(posres_df,
                         'time',
                         'status')
posres_fit.summary[['coef', 'se(coef)', 'p']]| coef | se(coef) | p | |
|---|---|---|---|
| covariate | |||
| posres | 0.148076 | 0.161625 | 0.359579 |
However, the results change dramatically when we include other predictors in the model. Here we exclude the funding mechanism variable.
model = MS(Publication.columns.drop('mech'),
           intercept=False)
coxph().fit(model.fit_transform(Publication),
            'time',
'status').summary[['coef', 'se(coef)', 'p']]| coef | se(coef) | p | |
|---|---|---|---|
| covariate | |||
| posres | 0.570773 | 0.175960 | 1.179610e-03 |
| multi | -0.040860 | 0.251194 | 8.707842e-01 |
| clinend | 0.546183 | 0.262000 | 3.709944e-02 |
| sampsize | 0.000005 | 0.000015 | 7.507005e-01 |
| budget | 0.004386 | 0.002465 | 7.515984e-02 |
| impact | 0.058318 | 0.006676 | 2.426306e-18 |
We see that there are a number of statistically significant variables, including whether the trial focused on a clinical endpoint, the impact of the study, and whether the study had positive or negative results.
Reuse
CC SA BY-NC-ND
Citation
BibTeX citation:
@online{bochman2024,
  author = {Bochman, Oren},
  title = {Chapter 11: {Survival} {Analysis} - {Lab} Part 2},
  date = {2024-09-03},
  url = {https://orenbochman.github.io/notes-islr/posts/ch11/Ch11-surv-lab-2.html},
  langid = {en}
}
For attribution, please cite this work as:
Bochman, Oren. 2024. “Chapter 11: Survival Analysis - Lab Part
2.” September 3, 2024. https://orenbochman.github.io/notes-islr/posts/ch11/Ch11-surv-lab-2.html.